A long, long time ago, 1980s, I used to rely heavily on the concept of Secondary Average. Secondary Average is
Extra Bases on Hits
Plus Walks
Plus Stolen Bases
Divided by At Bats.
I like Secondary Average because it operates historically on the same scale as batting average, but focuses on the other things a hitter does, other than hit for average. As is true of batting average, .260, .270 is the norm throughout most of baseball history, but the spread is wider than batting average. Some players will hit .260 but with a Secondary Average of .120; others will hit .260 but with a Secondary Average of .450. If a player hits .280 but with a Secondary Average of .150, he’s not really going to create many runs, whereas if he hits .250 but with a Secondary Average of .400, he’ll change the scoreboard. I’ve demonstrated this before, many times, but not in the last five or six years, so I’m going to look at it again.
Secondary Average doesn’t resonate the way that it used to because people don’t take Batting Average so seriously anymore. When fans evaluated hitters primarily by their batting averages, Secondary Averages were a really useful concept. Since fans no longer rely on batting averages in the way they once did, Secondary Averages are less relevant, so whereas I used to write about this every year, I no longer do. The highest Secondary Average ever (400 or more plate appearances) was 1.088, by Barry Bonds in 2004, whereas the lowest ever was .034, by Mike Slattery in 1884. Bonds in that one season was the only player over 1.000, and the lowest since 1900 was .062, by Hal Lanier in 1968. Lanier, with 486 at bats, had 14 doubles, one triple, no homers, 12 walks and 2 stolen bases.
The steroid era kind of ruined the stat, Secondary Average, because phenomenal numbers became commonplace. Before 1990, if you had a .400 Secondary Average, that was terrific. In 1989 there were 11 major league regulars (400 or more PA) who had secondary averages of .400 or higher, led by Jack Clark at .521; Clark and Rickey Henderson were the dominant Secondary Average guys of that era. Then in 2000 you have 40 players over .400, led by Bonds at .648 and Giambi at .586. . ..Mark McGwire must have been hurt that year, because he was always in the .600-.700 range as well, sometimes higher. When you destroy the norms you destroy the stat. If there were 20 no-hitters in a season a no-hitter would lose its significance. If a player hits .400 in the next decade that will be a wonder, but if 20 players hit .400 in the next decade that would be a travesty. The steroid era made a travesty of the norms in Secondary Average.
Anyway, as we are getting control of the PEDs, the norms are coming back to reality. In 2013 there were eleven players who had secondary averages of .400 or higher—the same number as in 1989. The leaders in 2013 were:
|
First
|
Last
|
AB
|
H
|
2B
|
3B
|
HR
|
BB
|
SB
|
Batting
Average
|
Secondary Average
|
|
Chris
|
Davis
|
584
|
167
|
42
|
1
|
53
|
72
|
4
|
.286
|
.478
|
|
Mike
|
Trout
|
589
|
190
|
39
|
9
|
27
|
110
|
33
|
.323
|
.477
|
|
Miguel
|
Cabrera
|
555
|
193
|
26
|
1
|
44
|
90
|
3
|
.348
|
.456
|
|
Carlos
|
Gonzalez
|
391
|
118
|
23
|
6
|
26
|
41
|
21
|
.302
|
.448
|
|
Paul
|
Goldschmidt
|
602
|
182
|
36
|
3
|
36
|
99
|
15
|
.302
|
.439
|
|
Edwin
|
Encarnacion
|
530
|
144
|
29
|
1
|
36
|
82
|
7
|
.272
|
.430
|
|
Joey
|
Votto
|
581
|
177
|
30
|
3
|
24
|
135
|
6
|
.305
|
.429
|
|
Shin-Soo
|
Choo
|
569
|
162
|
34
|
2
|
21
|
112
|
20
|
.285
|
.409
|
|
David
|
Ortiz
|
518
|
160
|
38
|
2
|
30
|
76
|
4
|
.309
|
.409
|
|
Jose
|
Bautista
|
452
|
117
|
24
|
0
|
28
|
69
|
7
|
.259
|
.407
|
|
Giancarlo
|
Stanton
|
425
|
106
|
26
|
0
|
24
|
74
|
1
|
.249
|
.407
|
Jose Bautista and Giancarlo hit .259 and .249, but were productive players because they had secondary averages over .400. On the other hand, J. B. Shuck and Marco Scutaro hit close to .300, but didn’t really do much to create runs:
|
First
|
Last
|
AB
|
H
|
2B
|
3B
|
HR
|
BB
|
SB
|
Batting Average
|
Secondary Average
|
|
Placido
|
Polanco
|
377
|
98
|
13
|
0
|
1
|
23
|
2
|
.260
|
.109
|
|
Jeff
|
Keppinger
|
423
|
107
|
13
|
1
|
4
|
20
|
0
|
.253
|
.111
|
|
Alcides
|
Escobar
|
607
|
142
|
20
|
4
|
4
|
19
|
22
|
.234
|
.133
|
|
Pete
|
Kozma
|
410
|
89
|
20
|
0
|
1
|
34
|
3
|
.217
|
.146
|
|
Adeiny
|
Hechavarria
|
543
|
123
|
14
|
8
|
3
|
30
|
11
|
.227
|
.147
|
|
Mark
|
Ellis
|
433
|
117
|
13
|
2
|
6
|
26
|
4
|
.270
|
.150
|
|
J.B.
|
Shuck
|
437
|
128
|
20
|
3
|
2
|
27
|
8
|
.293
|
.153
|
|
Starlin
|
Castro
|
666
|
163
|
34
|
2
|
10
|
30
|
9
|
.245
|
.161
|
|
Marco
|
Scutaro
|
488
|
145
|
23
|
3
|
2
|
45
|
2
|
.297
|
.168
|
|
Ichiro
|
Suzuki
|
520
|
136
|
15
|
3
|
7
|
26
|
20
|
.262
|
.169
|
The importance of secondary average, as opposed to batting average, can be demonstrated by focusing on the RUN columns of the batter’s record—runs scored, and RBI. We can do this in two ways, which are Run Average and the Run/Hit ratio. Run Average is (Runs + RBI)/ At Bats. Run/Hit Ratio is (Runs + RBI) / Hits. The norm in run average is essentially the same as the norm in Batting Average or Secondary Average, somewhere between .250 and .290, whereas the norm in the Run/Hit Ratio is about 1.00.
Alex Rodriguez in 1998 and Ichiro Suzuki in 2008 each had 686 at bats and 213 hits, but A-Rod had a secondary average of .382; Ichiro, of .213.

Kenny Lofton in 1996 and Felipe Alou in 1968 each had 210 hits in 662 at bats, but Lofton scored and drove in more runs because he had a much higher secondary average:

Bobby Bonds in 1973 and Frankie Baumholtz in 1947 each had 182 hits in 643 at bats, but Bonds had a secondary average of .443, whereas Baumholtz was at .198:

Billy Williams in 1967 and Bill Russell in 1977 each had 176 hits in 634 at bats, but Williams’ secondary average was more than twice Russell’s.

I have about a thousand more of those if anybody wants to see them. These are the Run Averages and Run/Hit Ratios for the ten players who had the lowest secondary averages in 2013:
|
First
|
Last
|
Batting Average
|
Secondary
Average
|
Run Average
|
Run/Hit Ratio
|
|
Placido
|
Polanco
|
.260
|
.109
|
.149
|
.571
|
|
Jeff
|
Keppinger
|
.253
|
.111
|
.184
|
.729
|
|
Alcides
|
Escobar
|
.234
|
.133
|
.180
|
.768
|
|
Pete
|
Kozma
|
.217
|
.146
|
.193
|
.888
|
|
Adeiny
|
Hechavarria
|
.227
|
.147
|
.133
|
.585
|
|
Mark
|
Ellis
|
.270
|
.150
|
.217
|
.803
|
|
J.B.
|
Shuck
|
.293
|
.153
|
.227
|
.773
|
|
Starlin
|
Castro
|
.245
|
.161
|
.155
|
.632
|
|
Marco
|
Scutaro
|
.297
|
.168
|
.180
|
.607
|
|
Ichiro
|
Suzuki
|
.262
|
.169
|
.177
|
.676
|
Players who have secondary averages below .200 typically have Run Averages around .200, and always have Run/Hit Ratios less than one. Players who have secondary averages over .400 typically have Run Averages over .300, and almost always have Run/Hit Ratios greater than one:
|
First
|
Last
|
Batting Average
|
Secondary
Average
|
Run Average
|
Run/Hit Ratio
|
|
Chris
|
Davis
|
.286
|
.478
|
.413
|
1.443
|
|
Mike
|
Trout
|
.323
|
.477
|
.350
|
1.084
|
|
Miguel
|
Cabrera
|
.348
|
.456
|
.432
|
1.244
|
|
Carlos
|
Gonzalez
|
.302
|
.448
|
.363
|
1.203
|
|
Paul
|
Goldschmidt
|
.302
|
.439
|
.379
|
1.253
|
|
Edwin
|
Encarnacion
|
.272
|
.430
|
.366
|
1.347
|
|
Joey
|
Votto
|
.305
|
.429
|
.299
|
.983
|
|
Shin-Soo
|
Choo
|
.285
|
.409
|
.283
|
.994
|
|
David
|
Ortiz
|
.309
|
.409
|
.361
|
1.169
|
|
Jose
|
Bautista
|
.259
|
.407
|
.343
|
1.325
|
|
Giancarlo
|
Stanton
|
.249
|
.407
|
.292
|
1.170
|
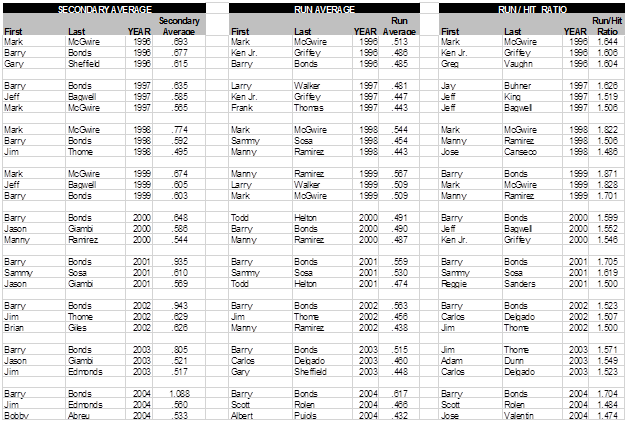
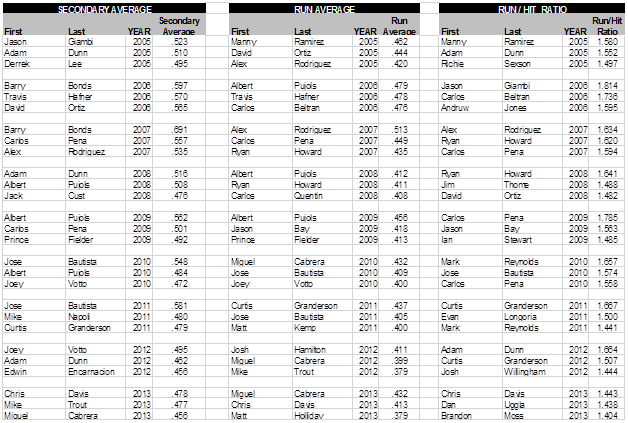
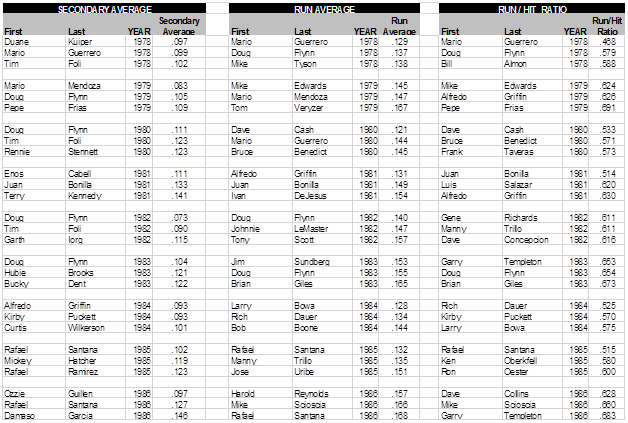
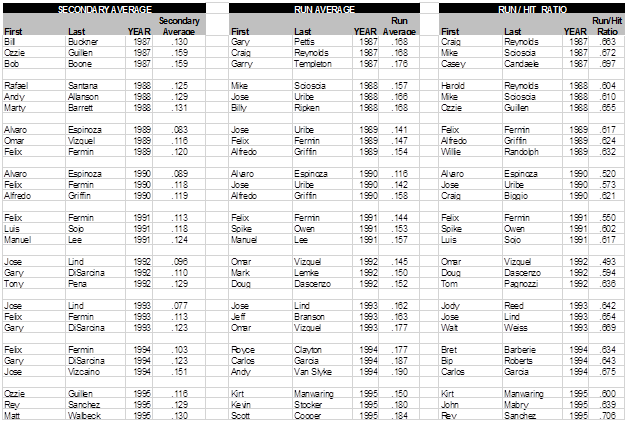
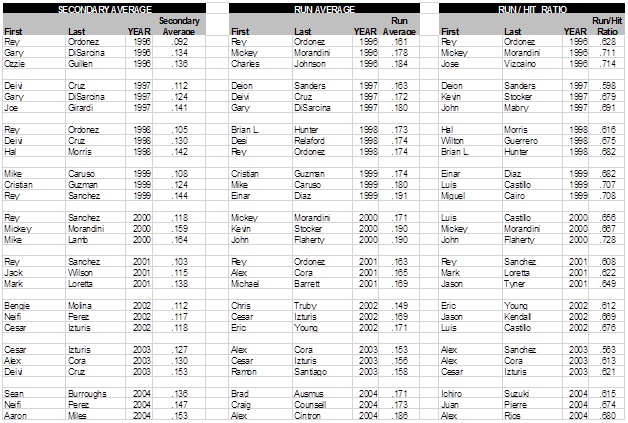
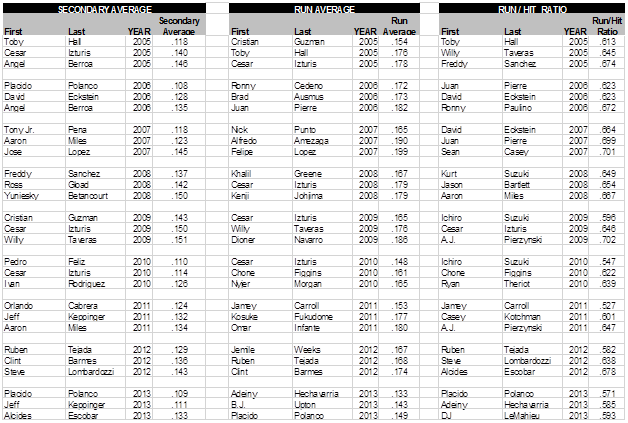
When we look at these things over a period of years, we find that those hitters who have the highest secondary averages are also the most productive hitters in terms of the Run Average or the Run/Hit Ratio:
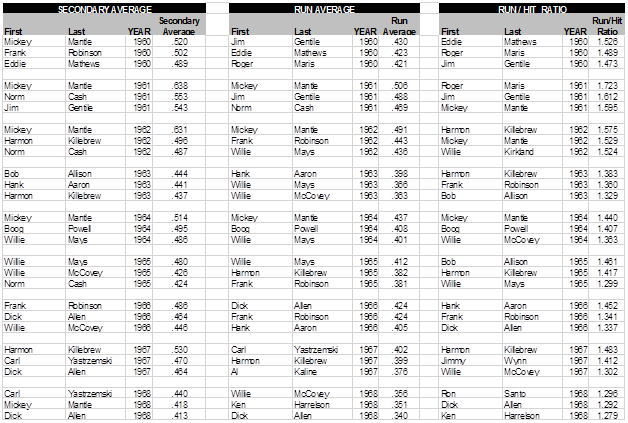
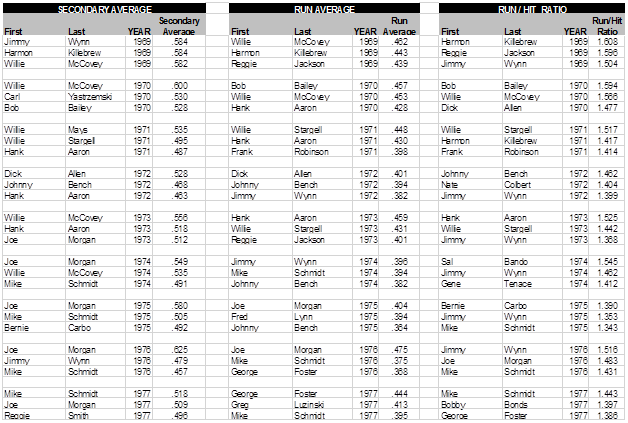
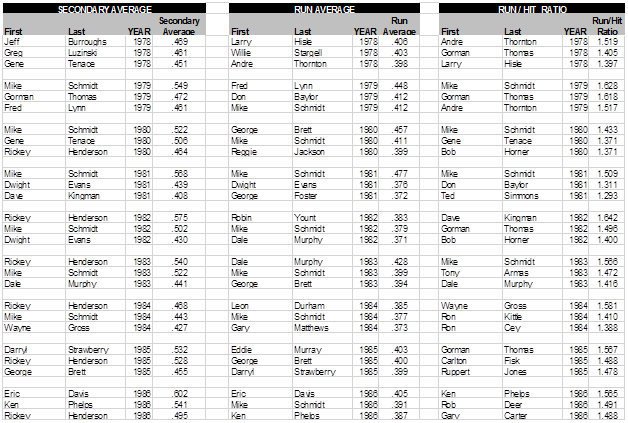
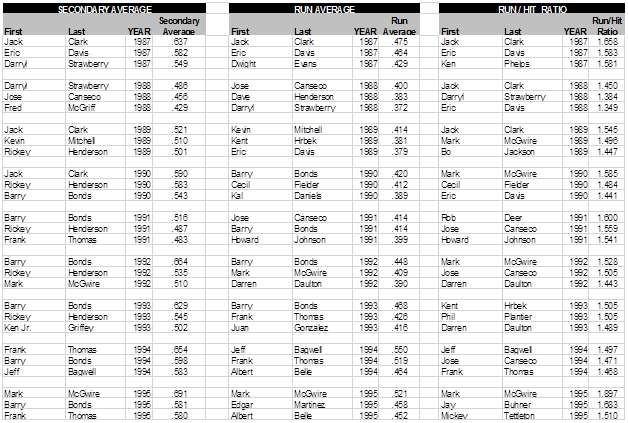
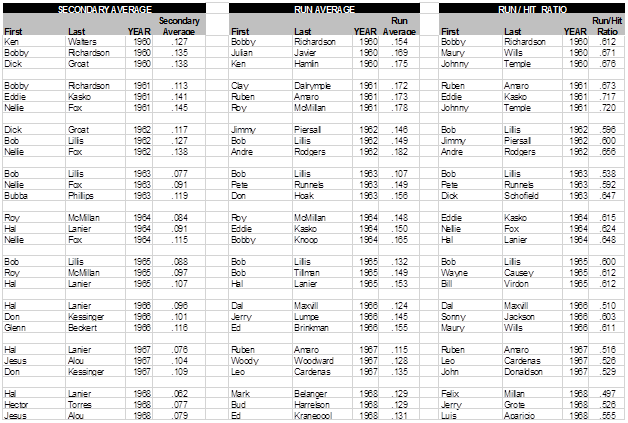
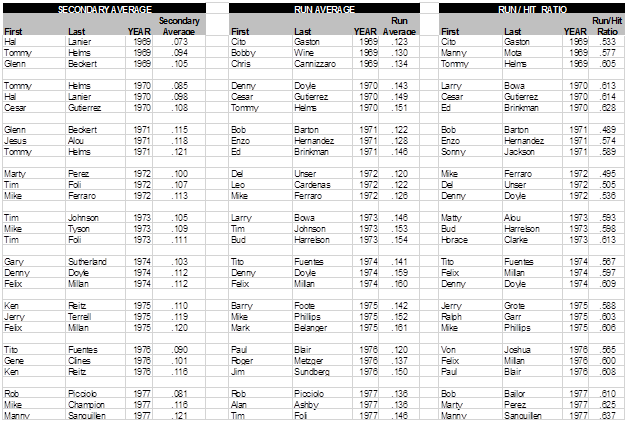
In the same way, those hitters who have the lowest secondary averages tend also to score and drive in the fewest runs:
Another thing I used to do, back in the dark ages, was to study the ratios of Wins to Strikeouts. If you identify the pitcher who had the highest ratio of Wins to Strikeouts, you have identified a pitcher who has a very, very high chance of having a catastrophic failure the next season.
In 1962, for example, Dick Donovan was 20-10 with a 3.59 ERA, but with only 94 strikeouts. That’s a strikeout-to-win ratio of 4.70 to 1, which was the lowest in the major leagues in 1962 (among pitchers with 10 or more starts and 100 or more innings pitched.) The next season Donovan was 11-13 with a 4.24 ERA; his ERA went up 65 points while the league ERA went down 42 points, so that’s a relative slide of more than a run. In 1963 the lowest strikeout to win ratio (thus the highest win to strikeout ratio) was by Warren Spahn, who went 23-7 but with only 102 strikeouts. Spahn’s long, long string of brilliant seasons skidded suddenly to a stop the next season.
All of the following pitchers
a) Had the highest Win to Strikeout Ratios in the majors, and
b) Suffered catastrophic declines in the following season:
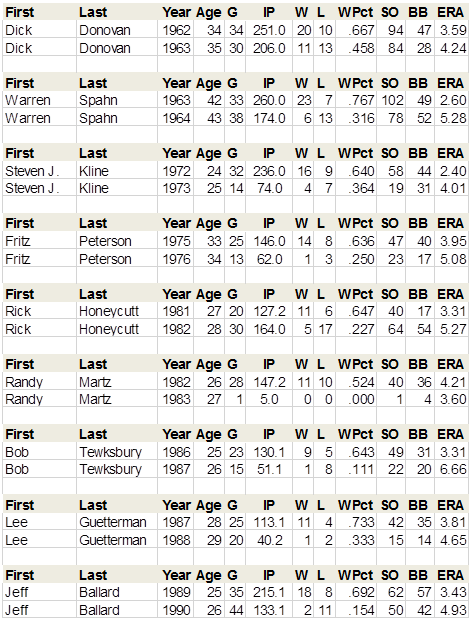
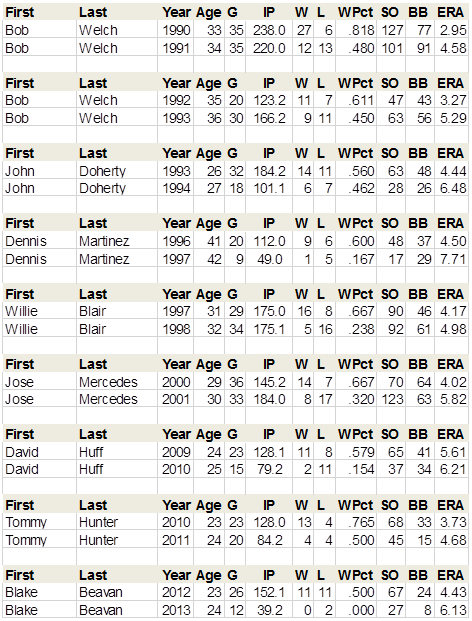
But even if the pitcher with the highest win/strikeout ratio doesn’t suffer a catastrophic decline in performance ("catastrophic" meaning that his performance decline is such that it calls into question the pitcher’s ability to continue in the major leagues). . ..even if there is not a catastrophic decline, almost all pitchers who bear this tag suffer SOME decline either in won-lost record or in ERA, or both—in many cases very significant declines in performance:
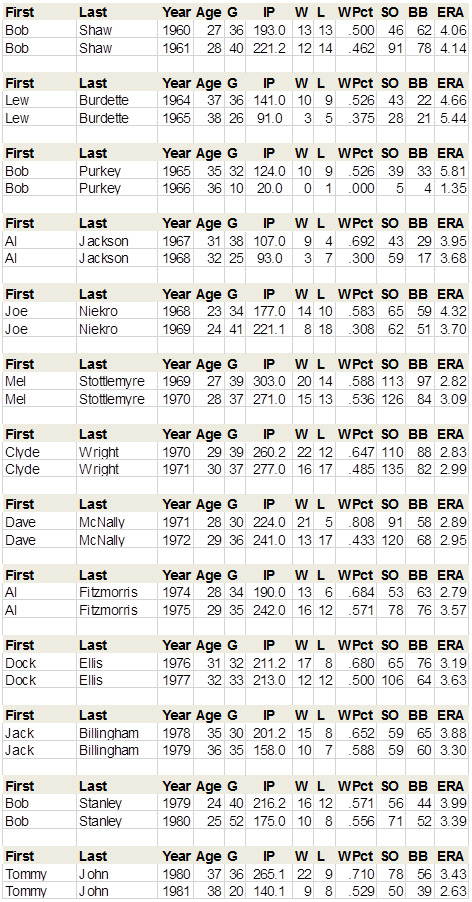
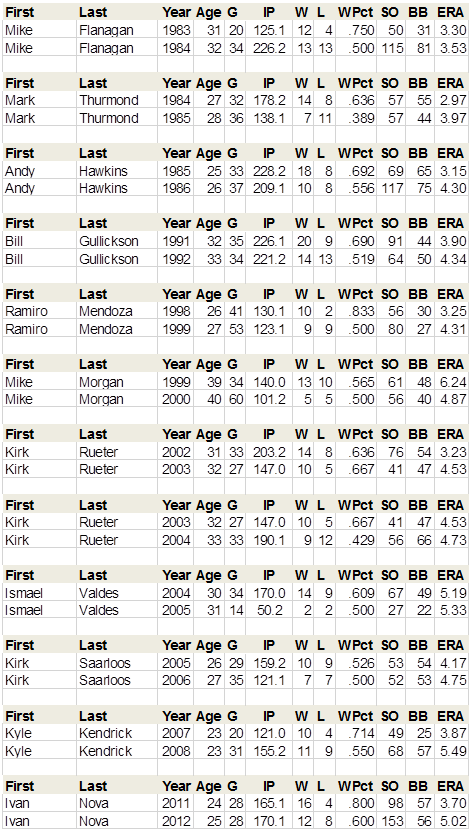
Since 1960 there have been ten pitchers who had the highest win/strikeout ratio in the majors, but did not suffer any real decline in performance the next season.
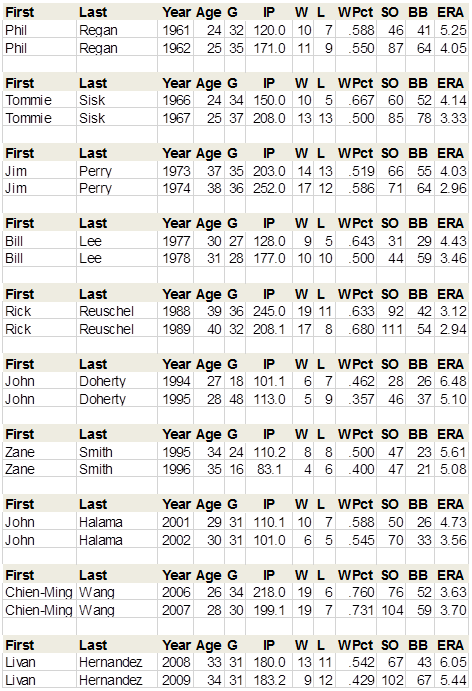
More comment on those guys in a moment. The trick works. . .that is, the "prediction" that this pitcher will suffer a serious decline in the following season is reliable. …because it combines two or three pieces of underlying knowledge into one. The pitcher who has a high ratio of wins to strikeouts almost always has benefitted from good run support, consequently is vulnerable in the next season because his run support is more likely to be normal. Also, a pitcher who has a low strikeout rate but is effective has probably benefitted from a low batting average on balls in play, which, in the same way, is likely to dissipate in the following season.
Of course, everybody knows that now; the practice is not useful in the way it was years ago because people no longer take won-lost records seriously in the way they used to do. When Pat Jarvis went 13-11 despite a high ERA in 1969, people actually thought that he was still a good pitcher; when Livan Hernandez went 13-11 with a bad ERA in 2009, everybody got it.
The pitcher who had the highest win to strikeout ratio in 2013, Jake Westbrook, was released in spring training and has not pitched at all in 2014. That would be the first time that has happened, which is consistent with the point I was just making. Actually, if you look at the ten "exceptions"—the ten pitchers who did not suffer any declines in performance in the next season—five of them are pitchers who were actually useless in Season 1, and did not suffer declines in performance the next season, merely because they continued to be useless. The five pitchers who had the highest win to strikeout ratios in a season and actually maintained or increased their value in the following season were Tommie Sisk in 1966, Jim Perry in 1973, Bill Lee in 1977, Rick Reuschel in 1988, and Chien-Ming Wang in 2006. And of those five, four suffered catastrophic losses in effectiveness in the next following season.
Third bit. . ..the expression "BABIP" has to rhyme with the only two English words which are spelled the same except for the initial consonant: Rapid, and Vapid.
Fourth. . ..The question or event which triggered this particular bit of research was that a pitcher I follow had several consecutive games in which he pitched well but did not win. This got me to wondering what the record was for consecutive starts like that.
I initially guessed, on intuition, that it might be 15 to 20 consecutive starts. Working it through, I realized that that was unrealistic. Let’s assume that a pitcher "Pitches Well" in a little more than 50% of his starts. Probably 70% of the time a pitcher does win when he pitches well, I figured—not true, but that was just my starting point—so that would suggest that a pitcher pitches well but does not win in about 16% of his starts, or one in six. If a pitcher pitches well/does not win one time in six, he would have consecutive such starts one time in 36, three in a row one time in 216, four in a row one time in 1300, five in a row one time in 7800, six in a row one time in 47000, seven in a row one time in 335,000, more or less. Since there are about 240,000 starts in my data, that would suggest that there should be one sequence in there of seven consecutive such starts.
The real math is more complicated, of course; it is less than one in 335,000 because there are thousands of different starting pitchers—thus, thousands of "breaks" in the sequence--but larger than one in 335,000 because the events will tend to form clusters.
Of course, by this time I know it isn’t 16%, it is 23%, so all that math is out the window. The actual record for consecutive starts in which a pitcher pitched well/did not win, within my data, is eight. There are three pitchers in my data who had eight consecutive qualifying starts:
Fred Norman, then pitching for the Padres, had eight consecutive qualifying starts between September 25, 1972 and April 28, 1973—three starts in 1972, five starts in 1973. The Padres were terrible—58-95 in 1972, 59-101 in 1973. In the eight starts he was 0-4 with a 3.25 ERA, 42 strikeouts, 23 walks in 55.1 innings.
Jose DeLeon, pitching for the Cardinals, had eight consecutive PW/DNW starts between August 2, 1991 and April 6, 1992, the first seven of those in 1991. That stretch has an asterisk, though, because DeLeon left one game after pitching two shutout innings, and another game after getting only two outs. My process regards those as good outings, but. . ..you know; it’s not exactly what we mean by "pitched well". I’ll explain that later. In the eight starts DeLeon was 0-1 with a 1.73 ERA, but pitched only 42.1 innings.
Tom Candiotti, pitching for the Dodgers, had eight consecutive PW/DNW starts between June 6 and July 11, 1993—the only pitcher in my data to have eight straight starts in a season. Candiotti was 0-1 with a 1.87 ERA in the eight starts, pitching 53 innings. In the eight starts, Candiotti was matched up against John Smoltz, Andy Benes, John Roper, Doug Drabek, Buddy Black, Chris Nabholz, Eric Hillman and Dwight Gooden. The Dodgers scored 22 runs in the eight games, gave up 22 runs, and went 4-4 in the eight contests.
While I was figuring that, of course, I first had to establish a method. "Pitched Well, Did Not Win" means a Game Score of at least 50; Did Not Win is self-explanatory. In my data there are 241,535 starts, of which 129,744 had game scores of 50 or above. That’s 53.6%. The 129,744 starting pitchers who "pitched well" had a won-lost record of 73,729 and 24,975, so that’s 56,015 starts in which a pitcher pitched well but did not win. 23% of total starts.
The 73,729 pitchers who pitched well and DID win had a collective ERA of 1.53. The 31,041 pitchers who pitched well/no decision had an ERA of 2.23. The 24,975 pitchers who pitched well but lost had an ERA of 2.85.
Of course, this leads to a million other questions to which, by this point, we can easily find the answers.
Who had the most PW/DNW games in a season?
Nolan Ryan in 1987 had 20 starts in which he pitched well but did not win. . . .that’s the famous tough luck season for Ryan; I am sure I don’t have to tell you which one it was. Jose Rijo in 1993 had 19 starts in which he pitched well/didn’t win, and three pitchers have had 18 starts: Roger Craig, with the Mets in 1963, Gil Meche, with the Royals in 2007, and Stephen Strasburg, with the Nationals in 2013.
Rijo in 1993 managed to go 14-9 despite having 19 starts in which he pitched well but did not win. He led the NL in Starts (36) and strikeouts (227), and had a 2.48 ERA. He finished fifth in the National League Cy Young voting, behind John Burkett, who had a 3.65 ERA, but went 22-7.
Ryan is also the career leader in games Pitched Well//Did Not Win. The top ten are:
|
First
|
Last
|
GS
|
PW/DNW
|
|
Nolan
|
Ryan
|
773
|
239
|
|
Don
|
Sutton
|
756
|
222
|
|
Bert
|
Blyleven
|
685
|
204
|
|
Tom
|
Seaver
|
647
|
196
|
|
Greg
|
Maddux
|
740
|
193
|
|
Roger
|
Clemens
|
707
|
190
|
|
Phil
|
Niekro
|
710
|
186
|
|
Gaylord
|
Perry
|
690
|
185
|
|
Steve
|
Carlton
|
709
|
175
|
|
Randy
|
Johnson
|
603
|
168
|
All ten of those pitchers had
a) 600 or more career starts, AND
b) A higher-than-average percentage of games in which they pitched well but did not win.
Among the ten, Nolan Ryan has both the most starts and the highest percentage of starts in which he pitched well but did not win (31%).
The highest career percentage of Games Pitched Well/Did Not Win, however, is Jose DeLeon, 39% (102 of 264)—but Matt Cain (going into 2013) was 102 of 265, almost the same. DeLeon was very much a tough-luck pitcher—86-119 in his career, although he was really a good pitcher.
On the other end of the scale, Jerome Robertson with the Astros in 2003 had 31 starts, but NONE in which he pitched well/did not win, and 32 in his career, both of which are records for a guy with no such starts. Robertson in 2003 went 15-9 despite a five-plus ERA.
Among pitchers with 100 starts, the lowest percentage of PW/DNW games was Chuck Rainey, early 1980s, at 11 out of 106, or 10%. Among pitchers with 200 starts, the lowest percentage was 14%, by Scottie McGregor, 43 out of 306, and among those with 400 starts, the lowest percentage is Mike Flanagan, at 17%. Tells us something about Earl Weaver’s Orioles: when the starting pitcher pitched well, they didn’t waste the effort.
At this point you should be saying to yourself "I don’t see a lot of 1960s references here." You’d figure in the 1960s there would have been a lot of games in which both pitchers had Game Scores over 50, so the 1960s pitchers might head up the lists of pitchers who had the most games of this type. Why don’t they?
The bias in that direction isn’t large enough to have much impact, except in 1968. In 1968 31% of all pitchers’ starts were Pitched Well/Did Not Win, which is the highest percentage for any season in my data. But other than ’67 and ’68, the data for the 1960s is fairly normal, and those two seasons just aren’t enough to make any noticeable dent in the data. The percentage of starts which were PW/DNW was 21% in 1952 (a pitcher’s year), then 17 to 19% from 1953 to ’56, 20 to 22% from 1957 to 1962. In 1963, when the strike zone was expanded, the percentage jumped to 25%, and was 23 to 26% from 1963 to 1966, then 28 and 31% in 1967-68. After the mound was lowered in 1969, the percentage dropped back to 23 to 26% from 1969 through 1974. From 1975 to 1987 it stayed in the range of 19 to 24%, then was a little higher from 1988 to 1993, 23 to 26%. From 1994 to 2004 it was 20 to 23%, from 2005 until 2010 most commonly 24%. In recent years, with run-scoring levels down, we’ve edged back up to 29%.