Ed Charles
In the Rookies study I published a week or so ago I mentioned that there were a small number of players who had decent careers although they were quite late getting to the major leagues. One of these was Ed Charles.
Ed Charles
1) Is the young kid portrayed in the movie "42",
2) Was known as the Poet Laureate of baseball (and you will spare us your literary insights here),
3) Was a member of the Kansas City A’s, the team of my childhood, from 1962 to early 1967,
4) Holds the Kansas City A’s record for career games played,
5) Really wasn’t a half-bad player for a guy who didn’t have a major league at bat until just before his 29th birthday, and then played for the Kansas City A’s.
Baseball Reference says that he was the 5th-best player in the American League as a Rookie in 1962, and by far the best rookie in the majors that season. That seems a little ambitious, actually. They have Norm Siebern, the A’s first baseman, as the 4th-best player in the league, Ed Charles 5th, which certainly casts some aspersions on the rest of that team, which lost 90 games. Charles was pretty good, though; he hit .288 with 17 homers, 81 runs scored, 74 RBI, 54 walks, an .811 OPS, 20 stolen bases in 24 attempts, and decent defense at third base.
It’s not all that easy to say why Charles didn’t get to the majors until he was 29. He missed a season with Military Service, but then, so did a lot of players who were major league regulars at 24. He just stalled out for a couple of years in the minors, and got behind the curve.
Anyway, I was wondering what Charles’ major league record might have looked like had he gotten to the majors on a normal schedule, so I looked for players whose career records, from age 29 on, are similar to Charles’. Here is a chart of players whose career records, beginning at the age of 29, meet that criteria:
|
First
|
Last
|
G
|
AB
|
R
|
H
|
2B
|
3B
|
HR
|
RBI
|
BB
|
SB
|
Avg
|
OBA
|
SPct
|
OPS
|
|
Ed
|
Charles
|
1005
|
3482
|
438
|
917
|
147
|
30
|
86
|
421
|
332
|
86
|
.263
|
.330
|
.397
|
.727
|
|
Tommy
|
Harper
|
884
|
3185
|
492
|
843
|
147
|
16
|
87
|
323
|
369
|
200
|
.265
|
.343
|
.403
|
.746
|
|
Hubie
|
Brooks
|
938
|
3326
|
393
|
890
|
171
|
13
|
108
|
505
|
225
|
30
|
.268
|
.314
|
.424
|
.738
|
|
Roy
|
White
|
929
|
3364
|
481
|
903
|
146
|
24
|
76
|
349
|
440
|
108
|
.268
|
.352
|
.394
|
.746
|
|
Benito
|
Santiago
|
1050
|
3610
|
394
|
964
|
180
|
20
|
119
|
495
|
254
|
19
|
.267
|
.316
|
.427
|
.743
|
|
|
|
|
|
|
|
|
|
|
|
|
|
|
|
|
|
|
Vada
|
Pinson
|
1034
|
3809
|
448
|
1011
|
172
|
37
|
75
|
404
|
197
|
101
|
.265
|
.302
|
.389
|
.691
|
|
Chet
|
Lemon
|
933
|
3147
|
417
|
830
|
177
|
26
|
99
|
415
|
358
|
12
|
.264
|
.346
|
.431
|
.777
|
|
John
|
Roseboro
|
1087
|
3316
|
334
|
840
|
132
|
19
|
52
|
360
|
349
|
36
|
.253
|
.325
|
.352
|
.677
|
|
Tony
|
Taylor
|
1190
|
3743
|
468
|
965
|
157
|
44
|
38
|
325
|
302
|
97
|
.258
|
.318
|
.354
|
.672
|
|
Jose
|
Cardenal
|
856
|
2766
|
388
|
805
|
157
|
10
|
50
|
328
|
299
|
108
|
.291
|
.360
|
.409
|
.769
|
|
|
|
|
|
|
|
|
|
|
|
|
|
|
|
|
|
|
Bill
|
White
|
915
|
3159
|
435
|
888
|
135
|
25
|
111
|
464
|
344
|
43
|
.281
|
.352
|
.445
|
.797
|
|
Carney
|
Lansford
|
874
|
3271
|
453
|
935
|
136
|
14
|
57
|
383
|
273
|
132
|
.286
|
.346
|
.388
|
.734
|
|
Tom
|
Herr
|
952
|
3342
|
400
|
897
|
172
|
17
|
22
|
396
|
421
|
111
|
.268
|
.350
|
.350
|
.699
|
|
Tony
|
Pena
|
1331
|
4127
|
416
|
1013
|
184
|
14
|
54
|
420
|
334
|
47
|
.245
|
.302
|
.336
|
.638
|
|
Alan
|
Trammell
|
1004
|
3657
|
529
|
1065
|
198
|
13
|
95
|
499
|
362
|
87
|
.291
|
.355
|
.430
|
.786
|
|
|
|
|
|
|
|
|
|
|
|
|
|
|
|
|
|
|
Chris
|
Chambliss
|
1198
|
3848
|
461
|
1053
|
193
|
15
|
110
|
519
|
379
|
26
|
.274
|
.339
|
.417
|
.756
|
|
Gary
|
Matthews
|
1006
|
3312
|
504
|
903
|
140
|
12
|
108
|
466
|
477
|
82
|
.273
|
.362
|
.420
|
.782
|
|
Tommy
|
Davis
|
1024
|
3647
|
347
|
1035
|
131
|
13
|
51
|
514
|
196
|
62
|
.284
|
.320
|
.369
|
.688
|
|
|
|
|
|
|
|
|
|
|
|
|
|
|
|
|
|
|
Terry
|
Pendleton
|
1087
|
4046
|
493
|
1112
|
221
|
17
|
102
|
562
|
264
|
35
|
.275
|
.318
|
.413
|
.732
|
|
Bill
|
Skowron
|
1007
|
3376
|
366
|
908
|
143
|
22
|
123
|
476
|
214
|
4
|
.269
|
.317
|
.434
|
.750
|
|
Bobby
|
Murcer
|
950
|
3143
|
442
|
850
|
128
|
17
|
112
|
501
|
455
|
58
|
.270
|
.361
|
.429
|
.790
|
|
|
|
|
|
|
|
|
|
|
|
|
|
|
|
|
|
|
AVERAGE
|
1012
|
3461
|
433
|
935
|
160
|
20
|
83
|
435
|
326
|
71
|
.270
|
.335
|
.401
|
.735
|
That’s Gary Matthews Sr., by the way, and yes, I did cherry-pick the list a little bit, eliminating the lesser players. I’m not arguing that Charles might have been as good a player as Bill White or Roy White, given an earlier opportunity; I am merely suggesting that it is not a ridiculous thing to say.
Willie Mays Seasons
Here’s another silly little thing I did. A few of you will remember a bit I did years ago called "Faux Zeke Bonura" or some such. The idea is that each player owns a defined set of statistical parameters. Let us take, for example, these seasons:
|
G
|
AB
|
R
|
H
|
2B
|
3B
|
HR
|
RBI
|
BB
|
SO
|
SB
|
CS
|
Avg
|
OBA
|
SPct
|
OPS
|
|
153
|
581
|
92
|
204
|
27
|
14
|
6
|
78
|
75
|
55
|
18
|
18
|
.351
|
.427
|
.477
|
.904
|
|
150
|
593
|
117
|
203
|
36
|
13
|
3
|
61
|
65
|
43
|
12
|
13
|
.342
|
.411
|
.462
|
.873
|
|
156
|
634
|
117
|
202
|
38
|
8
|
2
|
53
|
68
|
80
|
12
|
0
|
.319
|
.391
|
.413
|
.804
|
|
149
|
639
|
108
|
192
|
33
|
9
|
5
|
67
|
57
|
39
|
7
|
3
|
.300
|
.361
|
.404
|
.764
|
|
|
|
|
|
|
|
|
|
|
|
|
|
|
|
|
|
|
148
|
600
|
101
|
190
|
38
|
10
|
6
|
63
|
74
|
36
|
15
|
10
|
.317
|
.393
|
.443
|
.836
|
|
150
|
597
|
110
|
193
|
29
|
7
|
2
|
43
|
99
|
30
|
12
|
0
|
.323
|
.420
|
.405
|
.826
|
|
141
|
588
|
131
|
193
|
30
|
11
|
7
|
70
|
82
|
68
|
15
|
4
|
.328
|
.414
|
.452
|
.866
|
|
154
|
595
|
95
|
177
|
37
|
5
|
13
|
83
|
58
|
58
|
3
|
3
|
.297
|
.360
|
.442
|
.802
|
|
|
|
|
|
|
|
|
|
|
|
|
|
|
|
|
|
|
152
|
562
|
80
|
183
|
33
|
5
|
10
|
60
|
79
|
57
|
3
|
4
|
.326
|
.408
|
.456
|
.863
|
|
156
|
617
|
90
|
191
|
30
|
3
|
11
|
83
|
51
|
50
|
9
|
3
|
.310
|
.366
|
.421
|
.788
|
|
159
|
645
|
94
|
215
|
34
|
14
|
7
|
67
|
49
|
36
|
21
|
11
|
.333
|
.377
|
.462
|
.839
|
|
|
|
|
|
|
|
|
|
|
|
|
|
|
|
|
|
|
161
|
643
|
94
|
206
|
40
|
6
|
12
|
72
|
67
|
70
|
17
|
10
|
.320
|
.380
|
.457
|
.837
|
|
161
|
653
|
107
|
240
|
42
|
3
|
8
|
78
|
96
|
61
|
2
|
1
|
.368
|
.450
|
.478
|
.928
|
|
154
|
573
|
85
|
187
|
35
|
3
|
13
|
78
|
87
|
79
|
6
|
1
|
.326
|
.416
|
.466
|
.882
|
These are what we could call "Pete Rose seasons". Actually, not a single one of those is an actual Pete Rose seasons; those are actually seasons by Ross Youngs (1920), Earle Combs (1925), Woody English (1931), Red Rolfe (1935), Buddy Lewis (1940), Stan Hack (1945), Dom DiMaggio (1950), Johnny Logan (1955), Pete Runnels (1962), Curt Flood (1965), George Brett (1976), Lou Whitaker (1983), Wade Boggs (1985) and Kevin Seitzer (1996).
They’re not actual Pete Rose seasons, but they could be. If you took out an actual Pete Rose season and snuck in one of those in its place, nobody would notice except Pete and his bookie. These are seasons that are within the statistical parameters owned and defined by Pete Rose’ career.
Here’s how I decide what is a Pete Rose season. First, I take the ten best actual seasons of Pete Rose’ career, and, let’s say, runs scored. In 1979, one of Pete Rose’s ten best seasons, he scored only 90 runs. In 1976, another of his ten best seasons, he scored 130 runs, so the actual range is 90 to 130 runs. This I expand by 10%, plus 1, rounded out, so 90 runs to 130 runs becomes 80 to 144 runs.
The ten actual seasons have 31 to 47 doubles, so we expand that out to 26 to 53 doubles. In this way, we establish statistical parameters for a Pete Rose season in 16 categories: Games, At Bats, Runs, Hits, Doubles, Triples, Home Runs, RBI, Walks, Strikeouts, Stolen Bases, Batting Average, On Base Percentage, Slugging Percentage, OPS, and Season Score. If a season falls within the Pete Rose parameters in all 16 areas, it’s a Pete Rose season.
Why, you will want to know, do we expand the parameters, rather than using the actual parameters of just those ten seasons?
Because if you don’t expand them, you’ll wind up with no qualifying seasons. In the case of Pete Rose, you actually would wind up with two "Pete Rose seasons" that weren’t actual Pete Rose seasons, which are Lou Whitaker (1983) and Dick Wakefield (1943). But in most cases, for great players, you will actually wind up with zero qualifying seasons, if you don’t expand the parameters. Even the other actual Pete Rose seasons won’t qualify—and the difference between Pete Rose’ tenth best season and his 14th best season is the difference between one McDonald’s hamburger and the next—but if you don’t expand the parameters, you’ll exclude the rest of Rose’s career as well. That exclusion is not a "natural" or "true" effect; it’s what you get if you treat the accidents of past statistics as if they were commands of nature. In real life a player who hits 30 to 35 doubles every year is going to hit 26 or 40 doubles once in a while; it just happens. If you exclude that possibility you exclude everything.
So I was looking at somebody, I forget who, and I thought "that’s a Willie Mays season". Then I got to wondering who had the most Willie Mays seasons, other than Willie Mays, and then I remembered writing here a few months ago that you could throw out all of Willie Mays’ career and reconstruct it with very similar seasons by other players, but that you could not do that with Rickey Henderson, and then I got a question in "Hey, Bill" about whether Mariano Rivera was one of the most unique players of all time, and whether there was any way to study that. So I decided to go to work on the problem—not the problem of how unique a player is; we have other ways of looking at that. Here I am working on the problem of "What is a Willie Mays season?"
In the history of baseball there are 47 Willie Mays seasons. This count (47) includes the ten best Willie Mays seasons, and actually, it includes 11 Willie Mays seasons; Mays’ 1960 season is not one of his ten best years, but it is within the parameters defined by his ten best years. So there are 36 Willie Mays seasons which are not by Willie Mays, which are:
Three by Frank Robinson (1959, 1961, 1966). (Robinson’s 1966 Triple Crown season is actually extremely similar to Mays’ 1965 National League MVP season.)
Three by Vladimir Guerrero (2000,2001, 2002).
Two by Duke Snider (1950, 1953).
Two by Henry Aaron (1962, 1963).
Two by Billy Williams (1965, 1970).
One each by Hack Wilson (1927), Sunny Jim Bottomley (1928), Goose Goslin (1930), Eddie Morgan (1930), Chuck Klein (1931), Mel Ott (1935), Indian Bob Johnson (1938), Johnny Mize (1940), Al Kaline (1955; Kaline was the youngest player to have a Willie Mays season), Carl Yastrzemski (1967), Dave Parker (1978), Don Baylor (1979), Rafael Palmeiro (1993), Chipper Jones (1996), Albert Belle (1998), Moises Alou (1998), Todd Helton (1999), Luis Gonzalez (1999), Magglio Ordonez (2000), Bernie Williams (2000), Brian Giles (2001), Gary Sheffield (2003), Albert Pujols (2006), and Ryan Braun (2011).
When you do Mays you have to do Mantle. There are actually 280 Mickey Mantle seasons in history. The reason the number is larger is that Mickey didn’t have as many great seasons as Mays did, so that, in defining the parameters of a Mickey Mantle season, we wind up using Mantle’s 10th-best season (1952) to set the parameters, which is not as impressive a season as Willie Mays’ 10th-best season (1963). Jimmie Foxx has almost as many Mickey Mantle seasons as Mickey Mantle does, 9; Mantle has 11, Foxx 9. (Like Mays, Mantle has a season which is not one of his ten best years, but which is within the parameters of his ten best seasons.) Let’s mix those seasons up and see if you can tell the real Mickey Mantle seasons from the Jimmie Foxx/Mickey Mantle seasons:
|
G
|
AB
|
R
|
H
|
2B
|
3B
|
HR
|
RBI
|
BB
|
SO
|
SB
|
CS
|
Avg
|
OBA
|
SPct
|
OPS
|
|
|
144
|
474
|
121
|
173
|
28
|
6
|
34
|
94
|
146
|
75
|
16
|
3
|
.365
|
.512
|
.665
|
1.177
|
|
123
|
377
|
96
|
121
|
15
|
1
|
30
|
89
|
122
|
78
|
9
|
0
|
.321
|
.486
|
.605
|
1.091
|
|
124
|
467
|
130
|
168
|
31
|
10
|
35
|
105
|
89
|
72
|
4
|
3
|
.360
|
.464
|
.694
|
1.158
|
|
150
|
533
|
132
|
188
|
22
|
5
|
52
|
130
|
112
|
99
|
10
|
1
|
.353
|
.464
|
.705
|
1.169
|
|
149
|
517
|
123
|
183
|
23
|
9
|
33
|
117
|
103
|
70
|
9
|
7
|
.354
|
.463
|
.625
|
1.088
|
|
147
|
535
|
118
|
185
|
33
|
7
|
36
|
115
|
114
|
99
|
6
|
4
|
.346
|
.461
|
.636
|
1.096
|
|
150
|
539
|
120
|
180
|
28
|
6
|
44
|
130
|
111
|
75
|
11
|
2
|
.334
|
.449
|
.653
|
1.102
|
|
153
|
514
|
132
|
163
|
16
|
6
|
54
|
128
|
126
|
112
|
12
|
1
|
.317
|
.448
|
.687
|
1.135
|
|
150
|
519
|
127
|
158
|
21
|
1
|
42
|
97
|
129
|
120
|
18
|
3
|
.304
|
.443
|
.592
|
1.035
|
|
155
|
585
|
130
|
198
|
32
|
8
|
41
|
143
|
105
|
119
|
13
|
4
|
.338
|
.440
|
.631
|
1.071
|
|
147
|
517
|
121
|
158
|
25
|
11
|
37
|
99
|
113
|
97
|
8
|
1
|
.306
|
.431
|
.611
|
1.042
|
|
143
|
465
|
92
|
141
|
25
|
2
|
35
|
111
|
99
|
102
|
6
|
3
|
.303
|
.423
|
.591
|
1.015
|
|
144
|
515
|
106
|
153
|
30
|
4
|
36
|
119
|
101
|
87
|
4
|
7
|
.297
|
.412
|
.581
|
.993
|
|
135
|
487
|
87
|
146
|
27
|
8
|
19
|
105
|
93
|
103
|
2
|
5
|
.300
|
.412
|
.505
|
.917
|
|
146
|
543
|
129
|
163
|
17
|
12
|
27
|
102
|
102
|
107
|
5
|
2
|
.300
|
.408
|
.525
|
.933
|
|
153
|
527
|
119
|
145
|
17
|
6
|
40
|
94
|
111
|
125
|
14
|
3
|
.275
|
.399
|
.558
|
.957
|
|
127
|
461
|
105
|
136
|
24
|
3
|
21
|
92
|
79
|
90
|
8
|
4
|
.295
|
.398
|
.497
|
.895
|
|
142
|
549
|
94
|
171
|
37
|
7
|
23
|
87
|
75
|
111
|
4
|
1
|
.311
|
.394
|
.530
|
.924
|
|
150
|
569
|
111
|
162
|
24
|
6
|
36
|
127
|
99
|
96
|
10
|
8
|
.285
|
.392
|
.538
|
.929
|
|
139
|
515
|
93
|
150
|
32
|
10
|
30
|
120
|
73
|
84
|
4
|
3
|
.291
|
.380
|
.567
|
.947
|
Other players who have had multiple Mickey Mantle seasons are led by Chipper Jones, with 7, followed by Eddie Mathews (6), Mike Schmidt (6), Bernie Williams (6), Lance Berkman (6), Dolph Camilli (5), Duke Snider (5), Willie Mays (5), Frank Robinson (5), Gary Sheffield (5), Dick Allen (4), Eddie Murray (4), Brian Giles (4), Manny Ramirez (4), Jason Giambi (4),Babe Ruth (3), Indian Bob (3), Gil Hodges (3), Larry Doby (3), Bob Allison (3), Dave Winfield (3), Fred McGriff (3), Tim Salmon (3), Moises Alou (3), Jeff Bagwell (3), Ken Griffey Jr. (3), Alex Rodriguez (3), and Joey Votto (3).
There are 185 Henry Aaron seasons in history, which includes 14 by The Hammer himself, 171 by other hammers. We should call them Ball-peen seasons. The first player to have a Ball-peen season was Cy Williams in 1923 (.293 with 41 homers, 114 RBI); oddball players who have had Ball-peen seasons include Edgardo Alfonzo, Garrett Atkins, Rich Aurilia, Bob Cerv, Walt Dropo, Bobby Higginson, Larry Hisle, Paul Konerko, Whitey Kurowski, Sixto Lezcano, Hal McRae, Melvin Mora, Ben Oglivie, and Wally Post. The leaders in Henry Aaron seasons are Willie Mays (9), Frank Robinson (8), Vladimir (6), Ernie Banks (4), Billy Williams (4), Eddie Murray (4), Mike Piazza (4), Magglio Ordonez (4) and Albert Pujols (4).
We have 112 Pete Rose seasons—twelve by Rose himself, five by Dom DiMaggio, five by Wade Boggs, four by Stan Hack. There are 40 Ted Williams seasons in history, ten by Williams himself, four by Lou Gehrig, four by Mel Ott, four by Stan Musial, three by Frank Thomas, two each by Johnny Mize and Todd Helton, and one each by Rogers Hornsby (1928), Babe Ruth (1931), Earl Averill (1934), Jimmie Foxx (1939), Bill Nicholson (1944), Ralph Kiner (1951), Willie McCovey (1969), Wade Boggs (1987), Rafael Palmeiro (1999), Brian Giles (2000), and Gary Sheffield (2000). The last Ted Williams seasons were by Todd Helton in 2003 and 2004.
I have 42 Babe Ruth seasons in history, including one by Norm Cash. Foxx had six of those, Greenberg 4, Pujols 4, Gehrig 3, and Duke Snider 3. How many "copycat" seasons a player has is a measure both of his greatness and his uniqueness. It’s a lot easier to have a season that looks like Luis Alicea than a season that looks like Rogers Hornsby. There are 368 Bill Mazeroski seasons in history. All three generations of the Bell family had multiple Bill Mazeroski seasons—three by Gus Bell, three by Buddy, and two by David. Wally Post had a Bill Mazeroski season, too. I should trim that list by adding the requirement that the player has to be a second baseman. (I did that. It’s a boring list. Let’s skip it.)
Here’s a great trivia question that almost works: Which member of the Bell family had the highest career OPS. Answer: Mike Bell.
Unfortunately, it is not true, but it is almost true. David Bell, the third-generation Bell, had a brother named Mike, who had a very brief major league career, 27 at bats. Mike’s OPS in the majors, though, was .767, which is the same as the rest of the family—Gus Bell, .775; Buddy Bell, .747; David Bell, .716. If Mike Bell had had just one more total base, or even if he had drawn one more walk, or even if he had made just one less out, he would have had the best career OPS in the family.
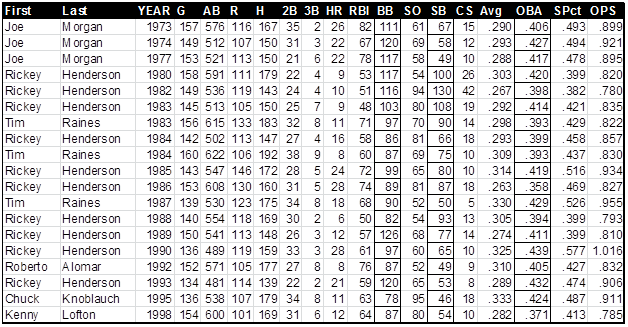
Finally, there are 19 Rickey Henderson seasons in baseball history, which I will present here in a chart. Rickey may be the champion in terms of having the fewest players who have seasons that could be his, but then, that could be somebody who was more odd than great, somebody like Maxie Bishop or Roy Thomas or Jeff Heath or somebody. Anyway, the Rickey Henderson seasons, in chronological order:
Pitcher Consistency
"Consistency" is one of the elusive spectres of sabermetrics, like clutch hitting and team chemistry. I had an exchange about this recently in "Hey, Bill", like this:
Q. Are some pitchers more consistent start-to-start than others? Put another way, do certain pitchers produce a higher number of quality starts over time than one would expect given their ERA?
A. Well. . .I don't know if I did this research and published it or did this research and didn't publish it, but it's pretty easy to figure the standard deviation of Game Scores for a pitcher, and I know I have done that and identified the most consistent and least consistent starting pitcher of each season since 1960. But I don't think that it really showed very much. The differences between the most consistent and least consistent starting pitchers were small enough whoever "led" the league would depend on where you established the cutoff. In other words, if you used 15 starts as the standard of eligibility, somebody starting 15-18 games would always be at the top of the list; if you used 20 starts, the leader would have 20-23 starts; if you used 25 starts, the leader would have 25 to 28. In other words, the real differences between pitchers were not large enough to shine through the relatively slight disadvantage of having more starts and thus more stable data. This is an indication that we're not really measuring anything significant.
Also, the pitchers who led one year (in consistency or inconsistency) had no apparent tendency to lead again the next year, which, again, is an indication that we're not really measuring anything. This is not to say that it's not worth looking at again or looking at in some other way, but I'm skeptical that there is anything there.
To this, a different reader posted the following:
One thing I always hear about promising young pitchers it that they need to be "more consistent". It seems to be received wisdom that a pitcher starts out mixing good starts with bad ones and improves, at least in part, by slowly getting rid of the bad outings and being more consistent about having his best stuff. I wondered if you saw any evidence of this in your data on games scores ("The Greatest of Games"). As pitchers improve their overall performance, their average game score would obviously improve. But does the variance come down as well? Are they just getting better? Or are they also getting more consistent?
They’re just getting better. A pitcher who isn’t really good can get good results sometimes just by the nature of the game. Let’s say that the pitcher who isn’t really good makes 10 mistakes in a game. The batters foul off five of them and hit line drives right at a fielder on three of them; he can pitch a shutout. But if he makes 10 mistakes in the strike zone again the next time out. .. .not so good. What people mean when they say that a pitcher is getting to be more consistent is simply that he’s getting better; that’s all.
Look. .. .we’re chasing a ghost here. There are arguments you can end; there are arguments that you can only feed. This is one of those arguments, like clutch hitting, that you can only feed. I am willing to feed the argument—within reason. So let me do some research here, and tell you as much as I can that seems to be objectively true.
First, we can measure a pitcher’s start-to-start consistency extremely well and extremely reliably. The Game Score system puts a starting pitcher’s performance on a zero-to-hundred scale very well; you can quibble about some little things, but. ..it’s a strong method. Second, standard deviations are one of the core practices of statistical analysis, a method used billions of times by millions of researchers. Third, there are no glitches or special challenges in putting together standard deviations with game scores. The standard deviation of a pitcher’s Game Scores is an excellent measure of his consistency. If it doesn’t tell us anything, that’s probably because there is nothing there.
The most consistent major league starting pitcher of the last 60 years is. . .. .wait a minute; you’re going to learn something you don’t know. Don’t say you never learned anything from reading Bill James Online; you’re going to learn something in just a second. One starting pitcher jumps out from the list as being more consistent than anybody else, and it doesn’t seem to be explainable as a statistical artifact of any kind. He’s too far ahead. Maybe it’s a statistical fluke, I don’t know, but it’s a big one. The pitcher who is easily the most consistent starting pitcher of the last 60 years was Jose Rijo.
You all remember Jose Rijo? Made 269 starts between 1984 and 2002, most of them for the Cincinnati Reds. Good pitcher, Juan Marichal’s son-in-law; had an ERA between 2.39 and 2.84 every year from 1988 to 1993. Pitched for Cincinnati in ten seasons and never had a losing record. We don’t have one data point that shows him to be the most consistent starting pitcher ever; we have several of them.
The data that I have here is taken from the Retrosheet play-by-play files, but it is not entirely up-to-date; some of it is three or four years old, and I haven’t blended in 2012 data yet. Basically, I have about every game from 1957 on except 2012, and some spotty data before 1957. Retrosheet has more stuff up online now, but I don’t have the technical skills to grab it as it comes on-line; I have to depend on my son to process stuff for me and put it into a spreadsheet.
Anyway, in the data I have, these are the ten most consistent starting pitchers who had 150 or more starts:
|
First
|
Last
|
|
Jose
|
Rijo
|
|
Bob
|
Walk
|
|
Scott
|
Karl
|
|
Steve
|
Trout
|
|
Kent
|
Mercker
|
|
Dennis
|
Rasmussen
|
|
Gary
|
Nolan
|
|
Brandon
|
Webb
|
|
Gil
|
Meche
|
|
Dave
|
LaPoint
|
What does it mean to say that these are the most consistent starting pitchers? It means that they have the lowest standard deviations of Game Scores.
Of course, someone could say "That’s not what I mean by "consistent". What I mean by ‘consistent’ is that he pitches well on a regular basis, not that he pitches the same on a regular basis." Well, OK; if that’s what you mean, that’s what you mean. But it’s not what "consistent" means. Look it up in any dictionary you like; "consistent" does not mean "good" or "well". It means the same, even.
These are the Standard Deviations of Game Scores for these pitchers, within my data:
|
First
|
Last
|
G
|
Avg
|
StDev
|
|
Jose
|
Rijo
|
269
|
56.0
|
14.44
|
|
Bob
|
Walk
|
259
|
49.2
|
15.21
|
|
Scott
|
Karl
|
161
|
45.5
|
15.25
|
|
Steve
|
Trout
|
236
|
47.1
|
15.48
|
|
Kent
|
Mercker
|
151
|
47.8
|
15.54
|
|
Dennis
|
Rasmussen
|
204
|
49.9
|
15.55
|
|
Gary
|
Nolan
|
247
|
56.5
|
15.57
|
|
Brandon
|
Webb
|
198
|
55.8
|
15.58
|
|
Gil
|
Meche
|
243
|
49.0
|
15.60
|
|
Dave
|
LaPoint
|
227
|
48.9
|
15.66
|
50 is an average Game Score, more or less. Jose Rijo’s career average was 56, Gary Nolan 56.5, Brandon Webb 55.8. Rijo had a career average of 56, with a Standard Deviation of 14.44. This, as you can see, is rather dramatically lower than anyone else’s. The difference between Rijo and the #2 man is larger than the difference between the #2 man and the #10 man, Dave LaPoint. Actually, the difference between Rijo and #2 is larger than the difference between #2 and #33. He’s way ahead.
Let’s add some more data to the chart. In Jose Rijo’s 269 career starts, his team’s won-lost record was 142-127.
|
First
|
Last
|
G
|
Avg
|
StDev
|
Tm Won
|
Tm Lost
|
W Pct
|
|
Jose
|
Rijo
|
269
|
56.0
|
14.44
|
142
|
127
|
.528
|
|
Bob
|
Walk
|
259
|
49.2
|
15.21
|
137
|
122
|
.529
|
|
Scott
|
Karl
|
161
|
45.5
|
15.25
|
85
|
76
|
.528
|
|
Steve
|
Trout
|
236
|
47.1
|
15.48
|
120
|
116
|
.508
|
|
Kent
|
Mercker
|
151
|
47.8
|
15.54
|
90
|
61
|
.596
|
|
Dennis
|
Rasmussen
|
204
|
49.9
|
15.55
|
109
|
95
|
.534
|
|
Gary
|
Nolan
|
247
|
56.5
|
15.57
|
144
|
103
|
.583
|
|
Brandon
|
Webb
|
198
|
55.8
|
15.58
|
108
|
90
|
.545
|
|
Gil
|
Meche
|
243
|
49.0
|
15.60
|
115
|
128
|
.473
|
|
Dave
|
LaPoint
|
227
|
48.9
|
15.66
|
112
|
115
|
.493
|
The 142-127 won-lost record of Rijo’s teams is 13 games worse than Pythagorean. In Rijo’s 269 career starts, his teams scored 1,157 runs and surrendered 990 runs, which should lead to a won-lost record of 155-114. They missed by a large margin, so there’s a little bit of evidence on another question: Does consistency help a pitcher win a larger percentage of his starts? Answer: it certainly didn’t for Jose Rijo.
It didn’t for Rijo, but that doesn’t appear to be a general truth. One of the pitchers on this list, Kent Mercker, substantially out-performed his Pythagorean, going 90-61 (or his team going 90-61) despite a small advantage in the runs scored/runs allowed (728 to 704). Overall, there is no clear pattern of pitchers on either end of the spectrum outperforming or under-performing their Pythagorean expectations.
So if Jose Rijo is Mr. Consistency, who is Mr. Inconsistency? Mark Mulder:
|
First
|
Last
|
G
|
Avg
|
StDev
|
Tm Won
|
Tm Lost
|
W Pct
|
|
Mark
|
Mulder
|
203
|
50.7
|
20.15
|
128
|
75
|
.631
|
|
Sandy
|
Koufax
|
314
|
62.8
|
19.66
|
206
|
108
|
.656
|
|
Bob
|
Porterfield
|
151
|
51.8
|
19.60
|
71
|
80
|
.470
|
|
Bob
|
Turley
|
235
|
54.8
|
19.36
|
134
|
101
|
.570
|
|
Jim
|
Maloney
|
262
|
57.8
|
19.20
|
156
|
105
|
.598
|
|
Sam
|
Jones
|
207
|
55.3
|
19.15
|
106
|
100
|
.515
|
|
Early
|
Wynn
|
358
|
55.2
|
19.07
|
209
|
149
|
.584
|
|
Juan
|
Marichal
|
457
|
59.2
|
19.06
|
280
|
177
|
.613
|
|
Gaylord
|
Perry
|
690
|
57.5
|
19.05
|
361
|
329
|
.523
|
|
Mike
|
Cuellar
|
377
|
56.3
|
19.00
|
217
|
160
|
.576
|
You will notice something right away. The list of the most inconsistent pitchers is a list of much better pitchers than the most consistent pitchers. None of the ten most consistent pitchers is in the Hall of Fame. Four for the most inconsistent pitchers are in the Hall of Fame—Koufax, Wynn, Marichal and Gaylord Perry. Two of the other six (Maloney and Cuellar) pitched at a Hall of Fame level, but just not long enough to be plaque-worthy, and the other four all won 20 games at least once. All ten pitchers on the least consistent list won 20 games at least once, whereas only one of the most consistent pitchers (Brandon Webb) ever won 20 games. How do we explain this?
I’ll offer three explanations, and then we’ll pick at them:
1) No pitcher has a career consisting entirely of brilliant seasons, whereas many pitchers have careers containing no brilliant seasons. A career like Koufax’s or Cuellar’s, then, mixes up brilliant seasons with long periods of frustration and failure. Measured against one center, that is what we call inconsistency.
2) Great pitchers are inconsistent because they have great games, dominating type games. Ordinary pitchers are "consistent" in that they’re never great.
3) Power pitching is (a) less consistent than finesse-type pitching, and (b) ultimately more dominant than finesse type pitchers. The best pitchers tend to be power pitchers; power pitchers tend to be inconsistent. Thus, the best pitchers tend to be inconsistent.
Bob Turley in 1954 struck out 185 batters and walked 181. In 1955 he struck out 210 and walked 177. That kind of pitching—and Sandy Koufax did a lot of that kind of pitching, early in his career—does not tend to be conducive to consistency.
Nolan Ryan doesn’t make the "most inconsistent" list, but he’s close; he’s 13th. Nolan Ryan’s 1979 season is the most inconsistent season in our data.
Backing off a little. . .the contrast between the top ten and the bottom ten overstates this difference. Good pitchers are in fact less consistent, game to game, than ordinary pitchers, but the overall difference is small. Some outstanding pitchers have low standard deviations of game scores; among these are Whitey Ford, Tom Glavine, Greg Maddux, and John Smoltz. In our own time Roy Oswalt, Freddy Garcia and Johann Santana all have low standard deviations of Game Scores. Not all good and great pitchers are inconsistent game to game, but. ..that is the tendency.
"A low standard deviation of Game Scores" sounds like a medical condition, and that’s not going to resonate with a lot of you, so let’s illustrate what that means in practice. Jose Rijo had 269 starts in his career. Suppose that we divide those into his best 135 starts, and his worst 134 starts, ranking the games by Game Scores.
|
Which
|
GS
|
IP
|
W
|
L
|
Pct
|
SO
|
BB
|
ERA
|
|
Good Starts
|
135
|
975
|
72
|
24
|
.750
|
880
|
257
|
1.57
|
|
Bad Starts
|
134
|
738
|
33
|
57
|
.367
|
590
|
324
|
5.37
|
Jose Rijo was 72-24 with a 1.57 ERA in his good starts, 33-57 with a 5.37 ERA in his bad starts, so that’s a big difference. At least, it looks like a big difference until we compare it to Sandy Koufax:
|
Which
|
GS
|
IP
|
W
|
L
|
Pct
|
SO
|
BB
|
ERA
|
|
Good Starts
|
157
|
1399
|
130
|
16
|
.890
|
1506
|
351
|
1.11
|
|
Bad Starts
|
157
|
804
|
29
|
69
|
.296
|
768
|
390
|
5.50
|
Koufax was much better than Rijo in his "good" starts—but somewhat worse than Rijo in his "bad" starts. (Actually, if you adjust for the park and era, he was quite a bit worse than Rijo in his "bad" starts.) For both Koufax and Rijo, their strikeout rate is not that much different in good starts are bad. Their bad starts are when they walk people—and also give up hits and home runs, but their control goes. Let’s also do Mark Mulder and Brandon Webb. This is Webb:
|
Brandon Webb
|
|
Which
|
GS
|
IP
|
W
|
L
|
Pct
|
SO
|
BB
|
ERA
|
|
Good Starts
|
99
|
732
|
65
|
12
|
.844
|
603
|
185
|
1.45
|
|
Bad Starts
|
99
|
553
|
22
|
50
|
.306
|
461
|
249
|
5.54
|
That’s the "consistent" guy; his ERA is four runs better in his good starts than in his bad starts. But Mulder’s is six runs better:
|
Mark Mulder
|
|
Which
|
GS
|
IP
|
W
|
L
|
Pct
|
SO
|
BB
|
ERA
|
|
Good Starts
|
102
|
779
|
78
|
10
|
.886
|
519
|
177
|
1.76
|
|
Bad Starts
|
101
|
533
|
25
|
50
|
.333
|
314
|
235
|
7.71
|
Here’s a Good Start/Bad Start breakdown for Nolan Ryan in 1979, the most inconsistent season in our data. It’s kind of a famous season. Ryan went 16-14 that year with a 3.60 ERA, after he had gone just 10-13 in 1978, but after the 1979 season he signed a contract to pitch for Houston for $1 million a season—the first million-dollar-a-year contract. (Actually, Dave Parker’s contract, signed months earlier, amounted to a million dollars a year, but the Pirates had put in all kinds of wrinkles to disguise the fact that they were paying a million a year. They claimed that it was only like $700,000 a year or something. You had to take the contract to two lawyers, an agent, an actuary and a tax accountant to figure out that it was actually a million. Ryan’s contract was just a million a year plus the signing bonus, period.) Anyway, Buzzie Bavasi was with the Angels then, and somebody asked him if it would be hard to replace Nolan Ryan. "Not hard at all," he said. "We’ll just get two 8-7 pitchers." Here’s the breakdown:
|
Nolan Ryan in 1979
|
|
Which
|
GS
|
IP
|
W
|
L
|
Pct
|
SO
|
BB
|
ERA
|
|
Good Starts
|
17
|
148
|
14
|
2
|
.875
|
159
|
56
|
1.22
|
|
Bad Starts
|
17
|
75
|
2
|
12
|
.143
|
64
|
58
|
8.28
|
Transitioning, then, to consistent and inconsistent seasons. "Sandy Koufax looks inconsistent," someone will argue, "because you have mixed together his great seasons and his bad seasons. But if you just focused on one season, I’ll bet he would be very consistent."
Well, OK.. .. ..these are the ten most consistent seasons in our data:
|
Year
|
First
|
Last
|
G
|
Average
|
StDev
|
|
1992
|
Jose
|
Rijo
|
33
|
58.9
|
9.55
|
|
1988
|
John
|
Dopson
|
26
|
54.6
|
10.16
|
|
2003
|
Kip
|
Wells
|
31
|
55.3
|
10.89
|
|
2011
|
Mat
|
Latos
|
31
|
56.1
|
10.94
|
|
1975
|
Fred
|
Norman
|
26
|
52.3
|
11.04
|
|
1988
|
Storm
|
Davis
|
33
|
50.4
|
11.07
|
|
1980
|
Steve
|
Carlton
|
38
|
65.5
|
11.10
|
|
1993
|
Hipolito
|
Pichardo
|
25
|
47.8
|
11.13
|
|
1995
|
Chris
|
Bosio
|
31
|
44.3
|
11.17
|
|
2004
|
Joe
|
Kennedy
|
27
|
52.0
|
11.49
|
Second data point for Jose Rijo, and there is a third. If you extend this list out to the top 100 most consistent seasons, only one pitcher appears on the list three times: Jose Rijo.
Steve Carlton is an exception—and Jose Rijo is an exception—but here again we can see that the pitchers who are most consistent are not generally power pitchers. But here, you will note that the seven pitchers who were most consistent all had average Game Scores over 50, so these were generally pitchers having pretty good seasons. Now the pitchers having the most inconsistent seasons:
|
Year
|
First
|
Last
|
G
|
Season
|
StDev
|
|
1979
|
Nolan
|
Ryan
|
34
|
57.4
|
23.94
|
|
1997
|
Jaime
|
Navarro
|
33
|
42.2
|
23.05
|
|
1967
|
Juan
|
Marichal
|
26
|
59.7
|
22.95
|
|
2001
|
Albie
|
Lopez
|
33
|
47.3
|
22.88
|
|
1968
|
Mike
|
McCormick
|
28
|
50.8
|
22.80
|
|
1960
|
Jack
|
Sanford
|
34
|
50.8
|
22.76
|
|
1980
|
Geoff
|
Zahn
|
35
|
46.8
|
22.73
|
|
1984
|
Dwight
|
Gooden
|
31
|
64.7
|
22.73
|
|
1988
|
Roger
|
Clemens
|
35
|
63.6
|
22.68
|
|
1978
|
Nolan
|
Ryan
|
31
|
58.6
|
22.67
|
Juan Marichal is kind of an odd one; he appeared on this list of inconsistent pitchers and also the other one. Marichal is hard to explain to those of you too young to remember, but Marichal’s managers really did tend to treat him as if he was super-human, and this led to some odd effects. Marichal would show up at the start of spring training ready to go, and—at least as I remember it—he would pitch 9-inning complete games, in spring training, usually about March 15. I’ll bet he pitched four or five complete games in spring training some years, which wasn’t as odd then as it would be now, but it was pretty odd even then.
Marichal’s managers would more or less let him do whatever he wanted to do, and sometimes this led to very extreme outcomes. You probably know that on July 2, 1963, Marichal pitched a 16-inning shutout—again, not as odd then as it would be now, but there weren’t a whole lot of 16-inning complete games even in 1963—and you may not know that Marichal also pitched a 14-inning shutout in 1966, and lost a 1-0 game in the 14th inning in 1969 (to the Mets, of course.) He pitched more than 9 innings in a game numerous other times. On the other hand, he also gave up 8 or more runs in a game seven times in his career, because he wouldn’t come out of the game if he was getting pounded, either. He pitched 11 innings against the Dodgers in 1968, giving up 14 hits and six runs. He gave up 16 hits in a game to the Mets in 1968—and still won the game. The Mets team batting average that year was .228; Marichal gave them 16 hits in a game and still beat them. He gave up a dozen or more hits in a game 20 times in his career.
These extreme outcomes measure in our system as inconsistency, and I guess I don’t know what else you would call it. It’s a different kind of inconsistency than any other pitcher has. If other pitchers were allowed to stay on the mound as long as they wanted to stay on the mound, they’d have weird game lines, too.
Anyway, I’m going to spray you with a little random data here, since I have assembled all this data and I have it at hand.
1) The highest average game score by any pitcher in a season (25 or more starts) was 76.1, by Bob Gibson in 1968, followed by 73.3, by Pedro in 2000.
2) The most games won in the starts of any pitcher in a season was 34, by Whitey Ford in 1961 (34-5) and Sandy Koufax in 1963 (34-6). Ford’s won-lost record was 25-4; Koufax was 25-5. That means that both teams, when the pitcher started but did not get the decision, were 9-1—a fact reflected in the won-lost records of Luis Arroyo (15-5) and Ron Perranoski (16-3).
3) The most games lost was 27, by Steve Arlin in 1972. Arlin was 10-21, and his team also was 0-6 when he started but did not get the decision.
4) The most runs scored for any pitcher was 244, by the Red Sox for Tom Gordon in 1996, 34 starts. Second on the list was Mike Mussina with the Orioles, the same year, 239 runs.
5) The most runs scored per game was 7.37, for Shawn Estes in 2000 and Jamie Moyer in 1997. Both pitchers made 30 starts and had the benefit of 221 runs.
6) The fewest runs per game was 2.14, for Jack Fisher with the White Sox in 1968. Fisher went 8-13, which is damned good when you only have 2.14 runs per game to work with.
7) The most runs allowed in the games started by any pitcher was 217, by the Astros with Jose Lima in 2000, and—I love this fact—the second-most runs allowed in any pitcher’s games was 216, by the Royals with Jose Lima in 2005.
8) The fewest runs allowed per game was 1.50, by the Cardinals with Bob Gibson in 1968.
9) The most runs allowed per game was 7.20, by the Astros with Jim Deshaies in 1994.
9) Gibson that season had 9 games with Game Scores of 86 or higher, which is two more than any other pitcher.
10) The most Game Scores of 76 or higher was 20, by Koufax in 1965.
11) The most Game Scores of 66 or higher was 30, by Koufax in ’63, Koufax in ’66, and Denny McLain in ’68.
12) Here’s an odd one. A Game Score of 35 to 44 is a not-very-good game, a game that you’re usually going to lose. But Jim Kaat in 1965 had 14 starts with Game Scores of 35 to 44—missing by just one of the highest total in that category anywhere in the data—and yet Kaat finished the season 18-11 with a 2.83 ERA, and his team was 29-13 in the 42 games that he started. The key is that Kaat had only two genuinely bad starts, with Game Scores below 35.
13) A notch below Kaat: Neal Heaton in 1984 had 13 starts with Game Scores of 25 to 34 (genuinely bad)—yet his teams were still 17-17 in the games that he started. The 13 starts in that group is the most in the data.
14) Jaime Navarro in 1997 and Ricky Nolasco in 2011 had 5 starts each with Games Scores under 15.
15) Nolan Ryan, of course, had the most Game Scores of 86 or higher in his career, 57. Randy Johnson was second with 45, Seaver third with 38.
16) Kenny Rogers had the most career Game Scores under 15, with 20.
17) The won-lost record of Ryan’s teams in the 773 games that he started was 405-368, just a .525 winning percentage, but on the other hand, Ryan’s teams scored just 3.80 runs per game in those games. 46 pitchers in the data (150 or more starts) had 3.90 runs per game to work with or less, and only one of them had a better team winning percentage than Ryan. Mel Stottlemyre, .529.
18) For his career, George Brunet had the poorest run support of any pitcher in the data, 3.46 runs per start (213 starts). He’s in the baseball Hall of Fame anyway—in Mexico. He went to Mexico after his American career ended, married a Mexican girl and is in the Mexico Baseball Hall of Fame. Brunet is followed by Lew Krausse (3.51), Ron Kline (3.52), Al Jackson (3.53) and Joel Horlen (3.54), none of whom is in the Mexico Baseball Hall of Fame.
19) For his career, Jaret Wright had the best run support in the study, 5.60 runs per start. Wright’s teams went 101-70 despite a career ERA of 5.09.
20) Sandy Koufax has the highest average Game Score for his career, 62.8, followed by Pedro (61.3), Bob Gibson (60.4), Tom Seaver (60.3) and the Big Unit (59.9).
21) Mark Hendrickson (the Other Big Unit) has the worst average Game Score in the study, 44.0.
22) The highest Standard Deviation of Game Scores, without a games limit, was by a Rockies pitcher named Mark Brownson in 1998. He made two starts, with Game Scores of 85 and 11. I’ll let you guess which game was in Colorado.
23) The lowest Standard Deviation of Game Scores, without a games limit, was by the pitcher drafted out of Quinsigamond Community College, Tanyon Sturtze. Sturtze made three starts for the Yankees in 2003—and had Game Scores of 49 all three games.
OK, should I print the list of the Most Consistent and Least Consistent pitcher every season since 1952? It’s a close call, but. …I’ve done this research. You don’t have to read it if you don’t want to. I note that Jack Sanford was the most consistent starting pitcher in the majors, game to game, in 1959—and the least consistent in 1960. But that’s the exception; there are a good many pitchers who repeat on one list or the other.
|
Year
|
Most Consistent
|
|
Least Consistent
|
|
1952
|
Robin
|
Roberts
|
|
Alex
|
Kellner
|
|
1953
|
Virgil
|
Trucks
|
|
Billy
|
Pierce
|
|
1954
|
Bob
|
Keegan
|
|
Joe
|
Coleman
|
|
1955
|
Erv
|
Palica
|
|
Jim
|
Wilson
|
|
1956
|
Sal
|
Maglie
|
|
Billy
|
Hoeft
|
|
1957
|
Tom
|
Sturdivant
|
|
Billy
|
Pierce
|
|
1958
|
Jack
|
Harshman
|
|
Early
|
Wynn
|
|
1959
|
Jack
|
Sanford
|
|
Don
|
Drysdale
|
|
|
|
|
|
|
|
|
Year
|
Most Consistent
|
|
Least Consistent
|
|
1960
|
Art
|
Ditmar
|
|
Jack
|
Sanford
|
|
1961
|
Curt
|
Simmons
|
|
Art
|
Mahaffey
|
|
1962
|
Robin
|
Roberts
|
|
Early
|
Wynn
|
|
1963
|
Ray
|
Sadecki
|
|
Johnny
|
Podres
|
|
1964
|
Lee
|
Stange
|
|
Hank
|
Fischer
|
|
1965
|
Fred
|
Talbot
|
|
Sammy
|
Ellis
|
|
1966
|
Al
|
Downing
|
|
Gaylord
|
Perry
|
|
1967
|
Ken
|
Johnson
|
|
Juan
|
Marichal
|
|
1968
|
Bob
|
Gibson
|
|
Mike
|
McCormick
|
|
1969
|
Ron
|
Reed
|
|
Rick
|
Wise
|
|
|
|
|
|
|
|
|
Year
|
Most Consistent
|
|
Least Consistent
|
|
1970
|
Les
|
Cain
|
|
Jim
|
Merritt
|
|
1971
|
Dick
|
Bosman
|
|
Mel
|
Stottlemyre
|
|
1972
|
Gary
|
Nolan
|
|
Rudy
|
May
|
|
1973
|
Balor
|
Moore
|
|
Jim
|
Bibby
|
|
1974
|
Carl
|
Morton
|
|
Mickey
|
Lolich
|
|
1975
|
Fred
|
Norman
|
|
Jerry
|
Koosman
|
|
1976
|
Bill
|
Bonham
|
|
Dave
|
Roberts
|
|
1977
|
Pete
|
Redfern
|
|
Gaylord
|
Perry
|
|
1978
|
Craig
|
Swan
|
|
Nolan
|
Ryan
|
|
1979
|
Jack
|
Morris
|
|
Nolan
|
Ryan
|
|
|
|
|
|
|
|
|
Year
|
Most Consistent
|
|
Least Consistent
|
|
1980
|
Steve
|
Carlton
|
|
Geoff
|
Zahn
|
|
1981
|
Dennis
|
Leonard
|
|
Mario
|
Soto
|
|
1982
|
Brad
|
Havens
|
|
Jim
|
Clancy
|
|
1983
|
Steve
|
Trout
|
|
Milt
|
Wilcox
|
|
1984
|
Eddie
|
Whitson
|
|
Dwight
|
Gooden
|
|
1985
|
Rick
|
Reuschel
|
|
Bill
|
Gullickson
|
|
1986
|
Steve
|
Trout
|
|
Charlie
|
Hough
|
|
1987
|
Doug
|
Drabek
|
|
Mike
|
Scott
|
|
1988
|
John
|
Dopson
|
|
Roger
|
Clemens
|
|
1989
|
Ken
|
Hill
|
|
Andy
|
Hawkins
|
|
|
|
|
|
|
|
|
Year
|
Most Consistent
|
|
Least Consistent
|
|
1990
|
Dave
|
Johnson
|
|
Mark
|
Gardner
|
|
1991
|
Mike
|
Morgan
|
|
Bob
|
Welch
|
|
1992
|
Jose
|
Rijo
|
|
Mark
|
Langston
|
|
1993
|
Hipolito
|
Pichardo
|
|
Kevin
|
Brown
|
|
1994
|
Jose
|
Rijo
|
|
Ron
|
Darling
|
|
1995
|
Chris
|
Bosio
|
|
Alex
|
Fernandez
|
|
1996
|
Armando
|
Reynoso
|
|
Paul
|
Wilson
|
|
1997
|
Matt
|
Morris
|
|
Jaime
|
Navarro
|
|
1998
|
Al
|
Leiter
|
|
Darryl
|
Kile
|
|
1999
|
Scott
|
Karl
|
|
Pedro
|
Astacio
|
|
|
|
|
|
|
|
|
Year
|
Most Consistent
|
|
Least Consistent
|
|
2000
|
Jimmy
|
Haynes
|
|
Tim
|
Hudson
|
|
2001
|
Jeff
|
Suppan
|
|
Albie
|
Lopez
|
|
2002
|
Jimmy
|
Haynes
|
|
Eric
|
Milton
|
|
2003
|
Kip
|
Wells
|
|
Odalis
|
Perez
|
|
2004
|
Joe
|
Kennedy
|
|
Bartolo
|
Colon
|
|
2005
|
Carlos
|
Silva
|
|
Javier
|
Vazquez
|
|
2006
|
Mike
|
Mussina
|
|
Jason
|
Marquis
|
|
2007
|
Jeff
|
Suppan
|
|
Braden
|
Looper
|
|
2008
|
Johan
|
Santana
|
|
Brian
|
Bannister
|
|
2009
|
Randy
|
Wolf
|
|
Ricky
|
Nolasco
|
|
2010
|
Rodrigo
|
Lopez
|
|
Edwin
|
Jackson
|
|
2011
|
Mat
|
Latos
|
|
Jason
|
Vargas
|