I had a question in "Hey, Bill" about cold teams; I think the question was "What is the coldest that any team has ever been?" I decided to study that question, and, of course, in order to answer THAT question, you have to construct an approach that addresses many other questions. What was the hottest team ever? What were the hottest teams of each decade. . .the 1950s, the 1960s, the 1970s, etc. What were the coldest teams of each decade?
On investigation, it is not clear that my method is well designed to answer THAT question—what is the coldest team ever? One uses a ladder to reach a high place, but one cannot stand on a ladder to reach the 59th floor of a skyscraper; that requires an elevator. One uses an elevator to reach a VERY high place, but one cannot use an elevator to reach an airplane. One uses an airplane to reach a very, VERY high place, but one cannot use an airplane to fly to the moon; that requires a rocket. Each method only works within a certain range of values.
The same with the team temperature gauge; it works within a certain range of values. I find this is a common syndrome, actually; very often I invent some way to measure something, and people immediately want to apply it to the most extreme case, and very often the method doesn’t work all that well in comparing the most extreme cases. People thus conclude that the method doesn’t work, when actually, the method works perfectly well; it just isn’t designed for the extreme case. One doesn’t conclude that a ladder is poorly designed because it cannot be used to reach the moon. It’s a perfectly good ladder; it just isn’t the tool we use to reach the moon. If you used a rocket ship to try to get the Christmas decorations off the top shelf of the closet, that wouldn’t work, either.
My team temperature method is designed to take the temperature of a team in ordinary conditions; in other words, in ordinary ranges of performance. The Kansas City Royals were hot last week, but then they got swept by Cleveland over the weekend, so should we now say that they are hot or cold? Where exactly are they, between hot and cold? Who is hotter right now: Buffalo, which has won 7 straight games but was 2-5 before that, or Indianapolis, which has taken two out of three in their last two series but had a 12-game winning streak before that? My method works pretty well in giving us a reasonable answer to those kinds of questions. In the most extreme cases, the historic cases, it just tends to tell you that the hottest team is the team which has had the longest winning streak and the coldest team is the team which has had the longest losing streak—not very useful information, or even necessarily correct.
Anyway, forget that I wrote all that; we’ll use this ladder to reach the moon here, and then we’ll pretend there’s no problem with it. When I was approaching THOSE questions (first paragraph), this led naturally into other questions. To what extent do this teams’ wins and losses form clusters? Is this a team that is prone to hot and cold stretches, or not? Did this team, at some point, get hotter than we would expect them to get, given their overall record? Which team had the most unusual combination of hot and cold stretches?
Do you know what the hottest team ever was? I’ll give you a hint: they made a movie about them. All of these questions will be answered; this little ladder is going to the moon.
1954 New York Giants
The 1954 New York Giants started out 9-11, and as of May 21 the team was still at .500 (16-16). They got red hot then, and stayed red hot until July 9, at which point they were 56-25. That’s a 40-9 stretch. They won 6 games, lost 2, won 1, lost 1 (7-3), won 4, lost 1 (11-4), won 4 more, lost 1 (15-5), won 6, lost 1 (21-6), won 4, lost 1 (25-7), won 8, lost 1 (33-8), won 1, lost 1 (34-9), and won 6 (40-9).
At the beginning of that the Giants’ temperature was 60 degrees; at the end, 136 degrees. They were the hottest team of the 1950s and, with one exception, the hottest team in my data.
What would really be fun with these hot streaks is to figure out who did what. I don’t have time for that, but I did figure a few players. In the 1954 Giants’ historic 49-game hot streak:
Willie Mays hit .376 with 22 homers, 51 RBI, an .840 slugging percentage and a 1.294 OPS.
Don Mueller hit .355 (71 for 200) and scored 36 runs.
Alvin Dark hit .308 with 11 doubles, 6 homers, and scored 40 runs.
Johnny Antonelli started 13 times and pitched once in relief, going 8-1 with a 2.22 ERA. He pitched three shutouts during the stretch.
Because of missing data, I can’t identify the coldest team of the 1950s. Probably the 1952 Pirates, but I’m not working with a full list of games. Or a full set of marbles.
The 1960 New York Yankees
The hottest team of the 1960s was the 1960 New York Yankees, who won their last 15 games to finish the season with an end-of-season temperature of 132 degrees.
The 1961 Philadelphia Phillies
Eddie Sawyer quit as manager of the 1960 Phillies one game into the season. When asked why he was leaving the job he said "because I am 39 years old and I would like to live to see 40." Gene Mauch got the team and won 59 games with the 1960 Phillies.
Mauch was ambitious, and he undertook an ambitious, long-term reconstruction of his roster. Several steps backward to gather momentum. The 1961 Phillies were never a decent team, and they had had some cold snaps early in the year. Their temperature dropped to 44 degrees by April 22, to 23 degrees by May 12, and to 18 degrees by July 13. By July 28 they were 30-64, and had already long since established their bona fides as one of the worst teams on record.
Then they went into a slump.
They lost the last two games of a home stand, to San Francisco, and headed out on the road. They lost 3 games in Cincinnati, dropping their team temperature to 28 degrees, and four more in St. Louis, cooling them off to 19. They returned home to lose three straight to Pittsburgh and one to Cincinnati; 13 straight losses, they were down to 12 degrees. They were shut out by Cincinnati, went on the road and were shut out twice more by Pittsburgh. 15 losses; they were down to 10 degrees.
They were able to score, in the finale in Pittsburgh, but lost the game 13 to 4; 16 losses, 9 degrees. 30 and 80. They lost three straight to the Cubs—the CUBS—which made 19 in a row, 30 and 83, team temperature of six degrees.
They went to Milwaukee for a five-game series. They lost the first game, 20 in a row, 30 and 84, still 6 degrees. They lost the second game, 21 in a row, 30 and 85, down to 5 degrees. They lost the third game, 22 in a row, 4 degrees. They lost the fourth game, 23 in a row, team temperature of 4 degrees.
The losing streak, one of the longest in baseball history, finally ended on Sunday, August 20, in the second game of a double header and the fifth game of a five-game series. Don Demeter went 3-for-5 with a homer and three RBI; John Buzhardt pitched a complete game, and the Phillies won 11-4.
The team temperature of 4 degrees, before that game, makes them coldest team in my data.
The 1964 National League Pennant Race
On September 20, 1964, these were the standings in the National League.
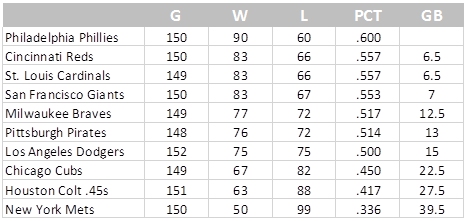
There were 12 or 13 games left for each team, so the Braves were virtually eliminated and everybody below them was eliminated, so we’ll drop them. These were the temperatures, at that moment, of the four contending teams:
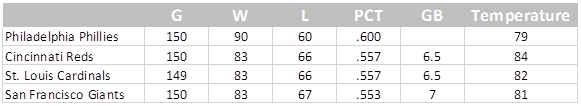
None of the teams was notably hot or notably cold at that point, and the Phillies seemed to have the race sewn up. The Phillies, as you know, turned tremendously cold while the other three teams all got hot. The Phillies, whose temperature had not dropped below 61 degrees at any point of the 1964 season, reached 26 degrees at the end of a ten-game losing streak. The Reds, whose temperature had not been above 104 degrees all summer, won 9 straight to reach 119 degrees. The Cardinals won 9 of their next ten games, pushing their temperature to a season-high 117 degrees. The Giants got hot, too, winning seven out of nine between September 22 and October 2, reaching a temperature of 99 degrees, but. . .under the circumstances they just weren’t quite hot enough. Cardinals won.
The 1965 Pirates
The 1965 Pirates opened the season by winning 5 of their first 7 games. They lost on April 21, but that was to Marichal and didn’t seem like anything; everybody loses to Marichal. Travelling to Houston, they lost four straight games to the Astros. Back to the West Coast, they lost their sixth in a row, then rallied to win the second game of that series. They were 6-8.
Flying to St. Louis, they were swept by St. Louis in a four-game series, dropping their record to 6-12. They won one game against Chicago but lost two, making them 3-12 on the road trip, 7-14 overall. They won one against Cincinnati but lost two; they were 8-16. They won the first one against Milwaukee but lost two; they were 9-18. Then they got really cold, losing four more to St. Louis—eight losses to St. Louis in two weeks—and being swept in a two-game set in Milwaukee.
By the end of that sequence (May 20, 1965) the Pirates were 9-24, buried in last place in the ten-team National League, and four full games behind the ninth-place New York Mets. Their temperature was 20 degrees. They had not won a series in more than a month.
This is what is unique about the 1965 Pirates: that they were actually a very good team, but they lost 22 out of 26 games. They went on to win 90 games. Had they played .500 ball during that 26-game stretch, they would have won the National League in 1965.
A team that goes 90-72 would normally have a low point during the season of 41 degrees. The Pirates dropped to 20 degrees. They were 21 degrees colder than a team of that quality would normally get—the largest "colder than normal" discrepancy anywhere in my data.
And then they immediately got white hot. They travelled to Milwaukee to complete the road trip, and dominated the Braves in three straight, 6-1, 9-4, 10-1. Coming home to face the Cubs, the Pirates squeaked out two narrow victories, 6-4 and 7-6 in 10 innings. They played one game in Philadelphia, won that; presumably there was a second scheduled game there that was rained out, but in any case it was a one-game series. By May 27, having won six straight, they had moved into a virtual tie with the Mets, both teams 10 games behind. Into New York on Friday, May 28, they outscored the Mets 34-6 in a four-game weekend series, winning all four games.
Returning home to face Philadelphia, Pittsburgh beat the Phillies 5-2 and 4-0, stretching their winning streak to 12 straight—but they were still under .500, and it was still early in the season. The Mets came in and got two games worth of revenge, but that was a five-game series, and the Pirates proved they were still hot, winning the last three games. Houston into town for three; they swept Houston, giving them five straight wins, 17 out of 19. A victory against San Francisco made it 18 in 20.
Their temperature at that moment was 116 degrees; in three weeks they had gone from 20 degrees to 116. The Pirates lost the middle game of the Giants’ series, but then won four of the next five. They were still hot, but not AS hot; they won four out of six and their temperature went down—just as they could have lost four out of six in late May and their temperature would have gone up.
One more note about the 1965 Pirates. The Pirates’ best pitcher was Vern Law, 17-9. Law had a very odd season. He lost his first five starts, despite a 2.95 ERA, but then won his next eight. Then he lost four in a row, then won his last nine. He was 0-5, 8-5, 8-9, 17-9. Very odd.
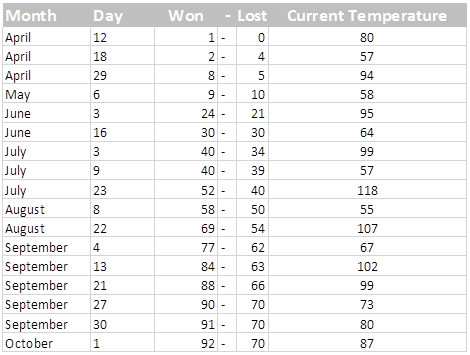
Temperature Summary for the 1967 Red Sox
The 1972 Texas Rangers
The ’72 Texas Rangers, managed by Ted Williams, lost 100 games in their first season in Texas. They would have lost more, but it was a strike-shortened season. Setting at 50-78 on September 3, the Rangers lost 21 out of 23 games to drop to 9 degrees. Coldest team of the 1970s.
The 1977 Kansas City Royals
On August 16, 1977, the Kansas City Royals were 64-51, in fourth place in the American League West behind the Twins, the White Sox and the Rangers. They won their next ten games then, pushing them to 74-51, but that’s not the hot streak; after that they lost three out of four.
Then they won 16, lost 1, and won another 8. That’s hot; 24 out of 25, 35 out of 39. The stretch ended on September 25, with the Royals owning the best record in baseball, and having clinched their division. I remember Whitey Herzog saying the next year (mid-summer, 1978) that the Royals in ’77 had had maybe the greatest stretch drive of all time. It didn’t really register with the press, but in fact. . .it’s pretty historic. The Royals on September 25 were the hottest team of the 1970s, and the third-hottest team within my data.
George Brett was hitting leadoff at the start of that stretch, after a 1976 season in which he had led the American League in hitting but with only 7 homers. By the end of the stretch he was hitting third. He played 36 of the 39 games, hitting .345 with 7 homers, 30 RBI, .414 on base percentage and .626 slugging.
The 1984 Detroit Tigers
The hottest team of the 1980s was the 1984 Detroit Tigers, who won 35 of their first 40 games, reaching a temperature of 131 degrees.
The 1988 Baltimore Orioles
The 1988 Orioles lost their first 21 games of the season (0-21), dropping them to a temperature of 7 degrees. This makes them the coldest team of the 1980s.
The 1991 Minnesota Twins
The hottest team of the 1990s was the 1991 Minnesota Twins, who reached a temperature of 129 degrees on June 16. The Twins had at that point won 18 out of 19 games.
1993 Cubs
The 1993 Chicago Cubs (84-78) followed a win with a win or a loss with a loss only 62 times. This is the smallest total of any team in my data, excepting of course the strike-shortened seasons. They are, in this sense, the polar opposite of the 2003 Tigers (below).
1997 Phillies
The 1997 Phillies, managed by Terry Francona, were in a continuous slump from the start of the season until the 4th of July, when they celebrated America’s independence with a record of 23-60 and a team temperature of 10 degrees, making them the coldest team of the 1990s. They had at that point lost 19 out of 20.
The rest of the season they were very good. They went 45-34 the rest of the season—and didn’t get out of last place. From July 28 to August 16 the Phillies won 14 out of 17, reaching a high of 110 degrees.
2001 Oakland A’s
The 2001 A’s, a 102-win team, started the season 2-10. At that point their temperature dropped to 31 degrees—twenty degrees colder than a 102-win team would normally get. Other than the 1965 Pirates, that is the greatest "colder than normal" discrepancy in our data.
Interestingly enough, the 2002 Oakland A’s are also fourth on that list; they also got to be 18 degrees colder than normal.
2002 Blue Jays
The 2002 Blue Jays, a 78-84 team, followed a win with a win or a loss with a loss 99 times, which is 18 times more than you would expect given that they were basically a .500 team. This is the largest discrepancy of that nature within my data.
2002 Oakland A’s
On May 21, 2002, the A’s lost to Baltimore, 4-6, dropping their record to 19-25. Their temperature at that point was 33 degrees. A win and a loss left them at 40 degrees; four straight wins after that pushed them to 77 degrees, above the room temperature that we use as the center of the system, but the team was still under .500 at 25-27. On June 5 they were 28-30.
Then began the first of the two phenomenal hot streaks that made the A’s season memorable. The A’s won 8 games, lost one, and won 8 more. That raised their temperature to 127 degrees which, had they stopped there, would have made them one of the 40 hottest teams of the last 60 years. At that point it was June 24, and the team was 44-31.
Over the next two months the A’s were normal; kind of hot some times, kind of cool other times. On August 11 and 12 they lost two games in a row, dropping their temperature from 97 to 78. Then they began the historic hot streak, depicted in the movie, winning 20 consecutive games to run their temperature to 137 degrees. That’s the hottest any team has been in the last 60 years.
2003 Detroit Tigers
The 2003 Tigers followed a win with a win or a loss with another loss 108 times, which is the highest total within my data. Mostly it was a loss with a loss; that team lost 119 games, which makes a lot of losing sequences.
Of course, the expected number of win-win and loss-loss sequences is higher for a very good team or a very bad team than it is for a .500 team. Within the normal range of performance the won-lost record makes very little difference in the number of win-win or loss-loss sequences. A .500 team can expect to follow a win with a win or a loss with a loss in 50% of their games. For a .600 team (or a .400 team) this increases only to 52% (.36 + .16). Almost all teams are in the range of .400 to .600, but for those exceptional teams that are more like .700 or .300, then you do get significantly more "matching strings". At .700, you get 58% matches (.49 + .09). Anyway, the 2003 Tigers (43-119) followed a win with a win or a loss with a loss 108 times, while no other team in my data did so more than 102 times.
Also, the 2003 Detroit Tigers lost on opening day, and never got their team temperature back to 72 degrees. 72 degrees is the "center" in this system, room temperature; if you’re above 72, you’re (at the moment) at least slightly warm. The 2003 Tigers are the one and only team in my data which never had a (post-game) temperature as high as 72 degrees.
2004 Tampa Bay
The 2004 Tampa Bay Devil Rays, managed by Lou Piniella, won 70 games and lost 91, finishing fourth in the American League East, ahead of Toronto. Their best players were Aubrey Huff, Carl Crawford and Rocco Baldelli.
Between June 9 and June 22, 2004, the D Rays won 12 straight games, pushing their temperature at that moment to 125 degrees. Between August 27 and September 10 they lost 12 straight games, dropping their temperature to 19 degrees. The 106 degree separation between their "hot point" and their "cold point" is the largest for any team in our data.
It’s actually 105.22 degrees, and the 1991 Mets also have a hot point/cold point separation of 105.22 degrees. But the Rays beat them if you carry the decimals.
2004 Arizona Diamondbacks
As of July 25, 2004, the D’Backs had lost 14 straight games and 17 out of 18, dropping to a temperature of 10 degrees. They were coldest team of this decade, and eventually lost 111 games. (The 2003 Tigers bottomed out at 12 degrees.)
2005 Cardinals
The 2005 St. Louis Cardinals were a 100-win team (100-62), but followed a win with a win or a loss with a loss only 63 times. We would expect a 100-win team to follow a win with a win 61 times and a loss with a loss 24 times, a total of 85. They were 22 under this expected total—the largest negative discrepancy within my data.
2011 Minnesota Twins
The 2011 Twins were not, it is fair to say, a great team. They lost 99 games.
Despite the 99 losses, the 2011 Twins had a tremendous hot streak. Between June 2 and June 21 they went 17-2, reaching a temperature of 116 degrees. This is 24 degrees hotter than we would expect a 99-loss team to be, at the hottest point.
The 2011 Twins are the polar opposite of the 1965 Pirates. The Pirates were a good team that got very, very cold. The Twins were a bad team that got very, very hot.
2011 Toronto Blue Jays
The 2011 Blue Jays, under John Farrell, finished 81-81. Joey Bats hit .302 with 43 homers, 132 walks.
What is unique about the 2011 Blue Jays is that they never got hot, and they never got cold. Their longest winning streak was six games; their longest losing streak, four. Their hot point, at the end of their six-game winning streak, was 95 degrees; their cold point, after seven losses in nine games, was 49 degrees. The 2011 Blue Jays are the opposite of the 2004 Devil Rays.
2012 Astros
Between June 28 and July 28, the Astros lost 25 out of 27 games, dropping to a low of 10 degrees. That makes them, so far, the worst or coldest team of this decade.
2013 Dodgers
The hottest team of this decade, so far, has been the Los Angeles Dodgers, who reached a temperature of 133 degrees on August 17, 2013. They had at that point won 10 straight games, and 41 out of 52.
General Patterns
99.4% of teams will at some point in the season have a temperature of at least 80 degrees.
96% of teams will at some point have a temperature of at least 90 degrees.
80% of teams will at some point in the season have a temperature of at least 100 degrees. An average team spends 11 days during the season with a team temperature of at least 100 degrees.
49% will reach 110.
17% will reach 120.
1% will reach 130.
On the other end, every team in the data except one was as low as 70 degrees at some point in the season. The one exception was the 2001Mariners (116-46), who never got below 71 degrees.
99% of teams at some point were at least as cold at 60 degrees.
92% of teams at some point were at least as cold as 50 degrees.
70% of teams were at least down to 40 degrees.
34% of teams were at least down to 30 degrees.
9% of teams got as cold as 20 degrees.
A little less than 1% of teams got down as low as 10 degrees.