126. Shortstops in Sequence
At the turn of the last century the greatest shortstop in baseball was Honus Wagner, who held that spot for more than ten years. After Wagner it was Maranville, after Maranville it was Bancroft, and after Bancroft, Joe Sewell, and each of those held the #1 spot for about three years. After Sewell it was Travis Jackson for about three years, and then Joe Cronin for about three years, and then for a long time it was Arky Vaughan. After Vaughan the best shortstop in baseball was Luke Appling, and after Appling it was Vern Stephens. After Stephens the best shortstop was Lou Boudreau, and then Reese and Rizzuto. After Reese and Rizzuto the #1 shortstop was Ernie Banks, then Maury Wills, then Jim Fregosi, then Bert Campaneris, then Dave Concepcion. After this two-decade run without a Hall of Fame shortstop, basically, then we get Robin Yount (after Concepcion), then Cal Ripken, then Alan Trammell, then Barry Larkin.
After Larkin we get the troika, A-Rod and Nomar and Dirty Rotten Jeter, all legitimate #1s although A-Rod was the best of them because of his big, big bat. After A-Rod the best were Hanley Ramirez and Jose Reyes, and then we get to the current generation of shortstops, of whom Corey Seager may be the best. (This was written before Seager’s injury, so maybe not; I don’t know.)
127. The Top Left Fielders of the 19th Century
|
Rank
|
First
|
Last
|
1
|
2
|
3
|
4
|
5
|
Pts
|
|
1
|
Jim
|
O'Rourke
|
3
|
6
|
1
|
2
|
0
|
80
|
|
2
|
Ed
|
Delahanty
|
6
|
1
|
0
|
0
|
0
|
67
|
|
3
|
Harry
|
Stovey
|
1
|
5
|
4
|
3
|
0
|
67
|
|
4
|
Pete
|
Browning
|
3
|
2
|
1
|
2
|
0
|
52
|
|
5
|
Charley
|
Jones
|
2
|
3
|
2
|
1
|
0
|
51
|
|
6
|
Tip
|
O'Neill
|
4
|
0
|
0
|
3
|
0
|
46
|
|
7
|
Jesse
|
Burkett
|
0
|
3
|
5
|
0
|
0
|
41
|
|
8
|
Joe
|
Kelley
|
1
|
3
|
2
|
0
|
1
|
40
|
|
9
|
Tom
|
York
|
2
|
2
|
1
|
0
|
1
|
39
|
|
10
|
Abner
|
Dalrymple
|
2
|
0
|
2
|
1
|
2
|
32
|
|
11
|
Elmer
|
Smith
|
0
|
2
|
0
|
4
|
1
|
23
|
|
12
|
Fred
|
Clarke
|
0
|
0
|
1
|
2
|
1
|
9
|
Joe Kelley was in mid-career in 1900, and had several pretty-good seasons in the 20th century.
Elmer Smith was basically finished by 1900, although he did play into the 20th century. He was one of those guys who started as a pitcher, moved to the outfield when he hurt his arm. There were a lot of those in 19th century baseball.
128. The Crab
At the opening of the 20th century the best Left Fielder in baseball was Jesse Burkett. Jesse was an ornery, cantankerous player, which I think you can actually see in this photo of him; I imagine that I can, anyway:
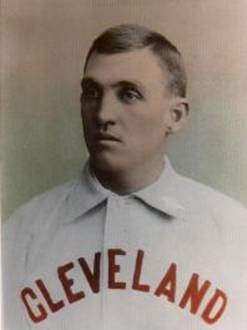
He just kind of looks like he is trying to find a reason to pick a fight with the photographer. The photo comes from his SABR biography by David Jones, which is excellent. Quoting the paragraphs which explain why he was known as "The Crab":
On and off the field, "The Crab"--as his Cleveland Spiders teammates dubbed him--was cranky and unsociable, prone to challenging opponents with his fists and insulting fans and umpires with strings of expletives so creative that sportswriters of the day could only reprint his repartee by omitting all the bad language, which usually made his harangues incomprehensible. In 1906, one publication rendered a Burkett tirade this way: "Why you blank, blankety blank, do you know what I think of you? I think you are the blankest blank blank that ever came out of the blank blankest town in the blank blank land. You ought to be put in a museum." Burkett's most notorious achievement may have come in 1897, when he was ejected from both ends of a doubleheader.
In 1921 Burkett was a coach with the New York Giants, who won the World Series, but Burkett was so unpopular with the players that they did not vote him a share of the World Series money. Burkett was a leadoff hitter in the era when many players had high averages; he hit .409 and .410 in 1895-1896. Ten players hit .400 in the 1890s—Ed Delahanty three times, Burkett twice, and Hugh Duffy, Willie Keeler, Sam Thompson, Billy Hamilton and Hughie Jennings once each. At that time a foul bunt was just a foul ball; you could roll bunts foul as long as you could make contact. Burkett has been described as the best bunter in baseball, understanding that other people were also described as the best bunter in baseball, but he was a good bunter in a game that allowed you to take more advantage of that than it does now. When the rule was adopted that a foul bunt on the third strike was an out, Burkett’s average dropped 70 points.
|
R
|
First
|
Last
|
YEAR
|
R
|
H
|
2B
|
3B
|
HR
|
RBI
|
BB
|
SB
|
Avg
|
OBA
|
SPct
|
Score
|
|
1
|
Jesse
|
Burkett
|
1900
|
88
|
203
|
11
|
15
|
7
|
68
|
62
|
32
|
.363
|
.429
|
.474
|
29.6
|
|
2
|
Kip
|
Selbach
|
1900
|
98
|
176
|
29
|
12
|
4
|
68
|
72
|
36
|
.337
|
.425
|
.461
|
25.7
|
|
|
|
|
|
|
|
|
|
|
|
|
|
|
|
|
|
|
1
|
Jesse
|
Burkett
|
1901
|
142
|
226
|
20
|
15
|
10
|
75
|
59
|
27
|
.376
|
.440
|
.509
|
33.2
|
|
2
|
Ed
|
Delahanty
|
1901
|
106
|
192
|
38
|
16
|
8
|
108
|
65
|
29
|
.354
|
.427
|
.528
|
31.7
|
|
3
|
Jimmy
|
Sheckard
|
1901
|
116
|
196
|
29
|
19
|
11
|
104
|
47
|
35
|
.354
|
.407
|
.534
|
30.8
|
|
4
|
Fred
|
Clarke
|
1901
|
118
|
171
|
24
|
15
|
6
|
60
|
51
|
23
|
.324
|
.395
|
.461
|
29.4
|
|
5
|
Sam
|
Mertes
|
1901
|
94
|
151
|
16
|
17
|
5
|
98
|
52
|
46
|
.277
|
.347
|
.396
|
24.4
|
Burkett was playing for the St. Louis Cardinals in 1900-1901. They were not a competitive team.
129. The Fred Clarke Era
We will describe the years from 1902 to 1910 as the Fred Clarke Era, although Clarke was not a dominant player or a superstar. The position was not weak because it was void of a superstar; there were several outstanding left fielders in those years—Sherry Magee, Jimmy Sheckard, George Stone, Topsy Hartsell, Sam Mertes and others. Turkey Mike Donlin played left field sometimes, when he wasn’t suspended or playing center field. Clarke was the only one to make the Hall of Fame because:
1) He kept himself in much better shape than the other guys did and avoided injury, thus was able to have a much longer period of success than most of them, and a longer period of success than any of them, and
2) Clarke managed the Pittsburgh Pirates from 1900 to 1915, a period of tremendous success for them, and probably would be in the Hall of Fame as a manager even if he did not have 2,700 hits, a .312 average and 500 stolen bases.
The National League in almost all of this era was divided into three super-teams and five perennial losers. The three super-teams were the Pirates, the Cubs and the Giants. From 1901 to 1913 the Pirates had a .618 winning percentage, were 458 games over .500, and won four National League pennants. The Cubs has a .612 winning percentage, were 436 games over .500, and also won four pennants. The Giants had a .597 winning percentage and were only 376 games over .500, but won five NL pennants. Everybody else in the league was under .500 and nobody else won a pennant. It was truly a haves-and-have-nots league. Frank Chance skippered the Cubs and is in the Hall of Fame, John McGraw led the Giants and is in the Hall of Fame, and Fred Clarke managed the Pirates and is in the Hall of Fame.
Clarke was a major league manager from an early age; he had managed Louisville for three years before he came to Pittsburgh. He saved his money, and bought a large ranch in central Kansas, where land was still cheap at that time. Oil was discovered on his land, so that made him even richer. He invested a little money in the team, and was part owner of the Pirates, which led to a famous incident in 1926 when Clarke, sitting on the bench and wearing a suit, second-guessed the manager. This led to a nasty all-over-the-newspapers round of players choosing sides; the principle owner (Barney Dreyfuss) had to break off a vacation in Europe to come home and sort things out. The Pirates, who were in first place at the time of the incident and who had won the league in 1925 and would win it in 1927, collapsed down the stretch, and the manager either resigned or got fired.
It is hard to explain, but baseball was in a transitional phase, and the Fred Clarke incident exposed the seams. Up to 1920, teams didn’t really have front offices. They had an owner, a traveling secretary, a bookkeeper, somebody who was in charge of selling tickets, and maybe one or two scouts, but the scouts worked for and reported to the manager. In the 1920s the modern front office began to evolve, and the responsibility for acquiring players shifted from the manager to the General Manager. Clarke was sort-of a front office guy and sort-of a coach, wearing a suit and sitting on the bench and probably playing golf with the owner, I don’t know. What nobody understood, until the Fred Clarke incident, was that this placed the coach in a position to undermine the manager. It wasn’t clear who outranked who in the dugout. After the Fred Clarke incident everybody understood that.
The commissioner a year or two later made the rule that (a) the owner could not manage the team, and (b) the manager had to be in uniform, except that Connie Mack would be allowed to manage in a suit as long as he owned the team. Everybody thinks that these rules were aimed at Judge Emil Fuchs in Boston, after Fuchs (the owner) took over the Braves and made a pretty disastrous effort to manage them, and the rules were aimed at Fuchs, but they were also in response to the Fred Clarke thing with the Pirates. Anyway, the left fielders of 1902 to 1910:
|
R
|
First
|
Last
|
YEAR
|
R
|
H
|
2B
|
3B
|
HR
|
RBI
|
BB
|
SB
|
Avg
|
OBA
|
SPct
|
Score
|
|
1
|
Fred
|
Clarke
|
1902
|
103
|
145
|
27
|
14
|
2
|
53
|
51
|
29
|
.316
|
.401
|
.449
|
30.7
|
|
2
|
Jimmy
|
Sheckard
|
1902
|
89
|
133
|
21
|
10
|
4
|
37
|
58
|
25
|
.265
|
.348
|
.371
|
28.3
|
|
3
|
Ed
|
Delahanty
|
1902
|
103
|
178
|
43
|
14
|
10
|
93
|
62
|
16
|
.376
|
.453
|
.590
|
28.2
|
|
4
|
Jesse
|
Burkett
|
1902
|
97
|
169
|
29
|
9
|
5
|
52
|
71
|
23
|
.306
|
.390
|
.418
|
28.1
|
|
5
|
Topsy
|
Hartsel
|
1902
|
109
|
154
|
20
|
12
|
5
|
58
|
87
|
47
|
.283
|
.383
|
.391
|
25.3
|
|
|
|
|
|
|
|
|
|
|
|
|
|
|
|
|
|
|
1
|
Jimmy
|
Sheckard
|
1903
|
99
|
171
|
29
|
9
|
9
|
75
|
75
|
67
|
.332
|
.423
|
.476
|
28.7
|
|
2
|
Fred
|
Clarke
|
1903
|
88
|
150
|
32
|
15
|
5
|
70
|
41
|
21
|
.351
|
.414
|
.532
|
28.6
|
|
3
|
Sam
|
Mertes
|
1903
|
100
|
145
|
32
|
14
|
7
|
104
|
61
|
45
|
.280
|
.360
|
.437
|
28.4
|
|
4
|
Jesse
|
Burkett
|
1903
|
73
|
151
|
20
|
7
|
3
|
40
|
52
|
17
|
.293
|
.361
|
.377
|
25.8
|
|
5
|
Topsy
|
Hartsel
|
1903
|
65
|
116
|
19
|
14
|
5
|
26
|
49
|
13
|
.311
|
.391
|
.477
|
25.6
|
|
|
|
|
|
|
|
|
|
|
|
|
|
|
|
|
|
|
1
|
Sam
|
Mertes
|
1904
|
83
|
147
|
28
|
11
|
4
|
78
|
54
|
47
|
.276
|
.346
|
.393
|
27.6
|
|
2
|
Topsy
|
Hartsel
|
1904
|
79
|
135
|
17
|
12
|
2
|
25
|
75
|
19
|
.253
|
.347
|
.341
|
24.3
|
|
3
|
Jesse
|
Burkett
|
1904
|
72
|
156
|
15
|
10
|
2
|
27
|
78
|
12
|
.271
|
.363
|
.343
|
23.8
|
|
4
|
Mike
|
Donlin
|
1904
|
59
|
121
|
18
|
10
|
3
|
52
|
28
|
22
|
.329
|
.382
|
.457
|
23.6
|
|
5
|
Jimmy
|
Slagle
|
1904
|
73
|
125
|
12
|
10
|
1
|
31
|
41
|
28
|
.260
|
.322
|
.333
|
23.4
|
|
|
|
|
|
|
|
|
|
|
|
|
|
|
|
|
|
|
R
|
First
|
Last
|
YEAR
|
R
|
H
|
2B
|
3B
|
HR
|
RBI
|
BB
|
SB
|
Avg
|
OBA
|
SPct
|
Score
|
|
1
|
Topsy
|
Hartsel
|
1905
|
88
|
147
|
22
|
8
|
0
|
28
|
121
|
36
|
.276
|
.411
|
.347
|
27.6
|
|
2
|
Sam
|
Mertes
|
1905
|
81
|
154
|
27
|
17
|
5
|
108
|
56
|
52
|
.279
|
.351
|
.417
|
26.9
|
|
3
|
Sherry
|
Magee
|
1905
|
100
|
180
|
24
|
17
|
5
|
98
|
44
|
48
|
.299
|
.354
|
.420
|
26.3
|
|
4
|
George
|
Stone
|
1905
|
76
|
187
|
25
|
13
|
7
|
52
|
44
|
26
|
.296
|
.347
|
.410
|
25.7
|
|
5
|
Fred
|
Clarke
|
1905
|
95
|
157
|
18
|
15
|
2
|
51
|
55
|
24
|
.299
|
.368
|
.402
|
25.1
|
|
|
|
|
|
|
|
|
|
|
|
|
|
|
|
|
|
|
1
|
George
|
Stone
|
1906
|
91
|
208
|
25
|
20
|
6
|
71
|
52
|
35
|
.358
|
.417
|
.501
|
31.6
|
|
2
|
Sherry
|
Magee
|
1906
|
77
|
159
|
36
|
8
|
6
|
67
|
52
|
55
|
.282
|
.348
|
.407
|
30.4
|
|
3
|
Topsy
|
Hartsel
|
1906
|
96
|
136
|
21
|
9
|
1
|
30
|
88
|
31
|
.255
|
.363
|
.334
|
26.1
|
|
4
|
Fred
|
Clarke
|
1906
|
69
|
129
|
14
|
13
|
1
|
39
|
40
|
18
|
.309
|
.371
|
.412
|
25.4
|
|
5
|
Jimmy
|
Sheckard
|
1906
|
90
|
144
|
27
|
10
|
1
|
45
|
67
|
30
|
.262
|
.349
|
.353
|
23.0
|
|
|
|
|
|
|
|
|
|
|
|
|
|
|
|
|
|
|
1
|
Sherry
|
Magee
|
1907
|
75
|
165
|
28
|
12
|
4
|
85
|
53
|
46
|
.328
|
.396
|
.455
|
33.6
|
|
2
|
Fred
|
Clarke
|
1907
|
97
|
145
|
18
|
13
|
2
|
59
|
68
|
37
|
.289
|
.383
|
.389
|
28.3
|
|
3
|
George
|
Stone
|
1907
|
77
|
191
|
14
|
13
|
4
|
59
|
59
|
23
|
.320
|
.387
|
.408
|
27.9
|
|
4
|
Topsy
|
Hartsel
|
1907
|
93
|
142
|
23
|
6
|
3
|
29
|
106
|
20
|
.280
|
.405
|
.367
|
26.7
|
|
5
|
Jimmy
|
Sheckard
|
1907
|
76
|
129
|
23
|
1
|
1
|
36
|
76
|
31
|
.267
|
.373
|
.324
|
23.0
|
|
|
|
|
|
|
|
|
|
|
|
|
|
|
|
|
|
|
R
|
First
|
Last
|
YEAR
|
R
|
H
|
2B
|
3B
|
HR
|
RBI
|
BB
|
SB
|
Avg
|
OBA
|
SPct
|
Score
|
|
1
|
Sherry
|
Magee
|
1908
|
79
|
144
|
30
|
16
|
2
|
57
|
49
|
40
|
.283
|
.359
|
.417
|
29.2
|
|
2
|
Matty
|
McIntyre
|
1908
|
105
|
168
|
24
|
13
|
0
|
28
|
83
|
20
|
.295
|
.392
|
.383
|
28.6
|
|
3
|
Fred
|
Clarke
|
1908
|
83
|
146
|
18
|
15
|
2
|
53
|
65
|
24
|
.265
|
.349
|
.363
|
27.8
|
|
4
|
George
|
Stone
|
1908
|
89
|
165
|
21
|
8
|
5
|
31
|
55
|
20
|
.281
|
.345
|
.369
|
25.2
|
|
5
|
Jake
|
Stahl
|
1908
|
63
|
134
|
27
|
16
|
2
|
65
|
31
|
30
|
.252
|
.321
|
.374
|
22.2
|
|
|
|
|
|
|
|
|
|
|
|
|
|
|
|
|
|
|
1
|
Fred
|
Clarke
|
1909
|
97
|
158
|
16
|
11
|
3
|
68
|
80
|
31
|
.287
|
.384
|
.373
|
27.8
|
|
2
|
Sherry
|
Magee
|
1909
|
60
|
141
|
33
|
14
|
2
|
66
|
44
|
38
|
.270
|
.340
|
.398
|
26.1
|
|
3
|
Jimmy
|
Sheckard
|
1909
|
81
|
134
|
29
|
5
|
1
|
43
|
72
|
15
|
.255
|
.346
|
.335
|
23.2
|
|
4
|
Patsy
|
Dougherty
|
1909
|
71
|
140
|
23
|
13
|
1
|
55
|
51
|
36
|
.285
|
.359
|
.391
|
22.1
|
|
5
|
Bob
|
Bescher
|
1909
|
73
|
107
|
17
|
6
|
1
|
34
|
56
|
54
|
.240
|
.335
|
.312
|
19.9
|
|
|
|
|
|
|
|
|
|
|
|
|
|
|
|
|
|
|
1
|
Sherry
|
Magee
|
1910
|
110
|
172
|
39
|
17
|
6
|
123
|
94
|
49
|
.331
|
.445
|
.507
|
29.1
|
|
2
|
Jimmy
|
Sheckard
|
1910
|
82
|
130
|
27
|
6
|
5
|
51
|
83
|
22
|
.256
|
.366
|
.363
|
24.1
|
|
3
|
Bob
|
Bescher
|
1910
|
95
|
147
|
20
|
10
|
4
|
48
|
81
|
70
|
.250
|
.344
|
.338
|
23.9
|
|
4
|
Birdie
|
Cree
|
1910
|
58
|
134
|
19
|
16
|
4
|
73
|
40
|
28
|
.287
|
.353
|
.422
|
22.8
|
|
5
|
Fred
|
Clarke
|
1910
|
57
|
113
|
23
|
9
|
2
|
63
|
53
|
12
|
.263
|
.350
|
.373
|
21.1
|
A few notes about the other guys:
Jimmy Sheckard was one of those weird players who could do anything, but who would be great at one thing one year and great at something else another year. At various times he led the league in runs scored, triples, homers, stolen bases, walks, on base percentage, and slugging percentage, although mostly he just led the league once in each thing; he did lead twice in walks and twice in stolen bases, and also twice in sacrifice hits. The other guys I can think of who were like that are Wally Moses, Tommy Harper and Toby Harrah; there is probably somebody more recent who has had a career like that, but I don’t know who. Sheckard was a really good player, but perhaps short of greatness.
Sam Mertes and Sherry Magee were power-hitting left fielders in a time when the position was mostly dominated by lead-off men. Magee led the league in RBI three or four times and some people think he should be in the Hall of Fame, but you know. . .so did George Foster.
George Stone was a tremendous player in the Ty Cobb mold, generally, but he got hurt after just a couple of good years.
Topsy Hartsel was a leadoff man who walked all the time and hit for a decent average—and you have to remember that at that time, walks were not even counted. Hartsel did not know that he had walked 121 times in 1905, because no one did at the time.
130. How Defensive Win Shares are figured for Outfielders
I had a request from a reader to explain how Defensive Win Shares for Outfielders are figured. I can’t do that, but I thought I would take a minute to explain why I can’t do that.
Defensive Win Shares are a cohesive system, in which we analyze the entire defensive performance of the team in order to know how much credit is given to each position. We don’t evaluate outfielders separate from the rest of the team, and we don’t do that because it can’t be done accurately. The entire system would require like 100 pages to explain, and to do just the outfielders (or just the shortstops, or just the second basemen) you would have to do most of that.
But I’ll take a minute to explain what I can. Figuring Defensive Win Shares for Outfielders requires that we find the answers to five questions:
1) How much credit goes to the team as a whole, including the credit for their hitting, base running, fielding and pitching?
2) Of the total credit to the team, how much goes to the defensive side (pitching and fielding) as opposed to the offensive?
3) Of the total defensive credit to the team, how much should we give to the pitchers, and how much to the fielders?
4) Of that credit which is given to the fielders, how much is given to the outfielders (as opposed to the infielders and the catcher?)
5) Of that credit which is given to the outfielders, how much goes to this particular outfielder?
The questioner to whom I am responding said that he knows the system has changed since I explained it years ago, but that’s not true. I can’t evaluate everyone by Win Shares and Loss Shares because the library—that is, the numbers for every player every year—does not exist. Anyway, Step One above is quite simple; the credit given to the team is simply based on how many games they have won. Step Two is not difficult; we divide credit between offense and defense based on the number of runs scored and allowed compared to the league norms, adjusted for the park.
But Step Three is complicated. Suppose that two teams in the same league are even in terms of runs scored, runs allowed, wins, losses and park factor. One team, however, has 1100 strikeouts, 450 walks, 130 home runs allowed, 100 errors, 130 double plays, 85 stolen bases allowed, and a .695 Defensive Efficiency Record, while Team B has 1000 strikeouts, 550 walks, 150 home runs allowed, but only 70 errors, 150 double plays, 55 stolen bases allowed, and a .710 DER. Obviously, more of the credit goes to the pitching on Team A than on Team B, while the fielders on Team B get more credit than the fielders on Team A. There’s probably some other stuff in there that I have forgotten, too; you have to look for everything that says "fielding" and everything that says "pitching", and then you balance them as best you can.
Step Four is as complicated as Step Three. You’re asking "How much of the credit goes to
a) The catchers,
b) The infielders, and
c) The outfielders.
So you’re asking questions like "How many double plays did they turn, relative to the number of runners on base and the number of ground balls allowed?" and "To what extent is a good DER attributed to the outfield, rather than the infield?", as well as more prosaic questions like "what’s the fielding percentage of the infielders, compared to the league norm, as compared to the fielding percentage of the outfielders, compared to the league norm?" Anything that helps you distinguish between defensive performance of the infield vs. the outfield.
Having done all of that, you move on to Step Five, which is crediting that Defensive Credit which goes the outfield to specific outfielders, based on individual defensive statistics.
Many people who evaluate defensive statistics want to start with Step Five. If two outfielders in the same league each have 270 putouts, 10 assists and 4 errors in 140 games, shouldn’t the two be rated the same? But no, they should not, and here’s why.
Defensive statistics tend to be about the same on a team level, whether it is a good defensive team or a poor defensive team. One way or the other you have to get to about 27 putouts per team per game, regardless of how bad a defensive team you might be. One team might give up 1300 hits and have 1200 strikeouts, so that the outfielder has 270 putouts out of 4500 balls in play, while another team might give up 1500 hits and have 900 strikeouts, so that it might be 270 putouts out of 5000 balls in play. The three basic things you have to evaluate a defender are range, double plays and errors, but range is neutralized on a team level, one team the same as another, and double plays increase as runners on base increase, so that there is minimal correlation between raw double play totals and wins. You can use things like Outfield Assists, but a bad team will actually have more Outfield Assists (on average) than a good team.
What is critical for evaluating a defense is not their successes, which are the same from team to team, but their failures, which are balls in play that DON’T become outs. Unless you have some way of taking those into account, you’re not really evaluating the fielder; you’re just doing some multiplying and dividing.
At least, that’s the theory; our system has failures and anomalies, too, and there’s actually a lot about it that I don’t understand. Also, since we have modern defensive metrics for modern players, these methods only apply to older players, so we’re dealing with archaic methods that have a constantly diminishing audience. Most people in sabermetrics aren’t really interested. So it’s a struggle, but I’m doing the best I can with it.