Sometime within the last month I had a question in "Hey, Bill" as to whether I still believed, as I have written before, that the switch from the four-man to the five-man rotation, which occurred between 1974 and 1984, was probably a mistake, and actually did nothing to reduce injuries by starting pitchers (or actually, that there was no evidence and no reason to believe that it had done anything to reduce injuries.) I replied that yes, that was still what I believe, to which another reader observed that even though there was no concurrent reduction of injuries when that change took place, it could be the case that there was some gain in starting pitcher effectiveness, pitching on four days rest as opposed to three days rest. I agreed that this was theoretically possible, and in consequence of that exchange I decided to see whether there was any evidence of a gain of effectiveness due to increased rest.
To study that issue, I formed three groups of starting pitchers; I will start by describing Group B. All of the pitchers in Group B:
1) Made at least 25 starts in the season,
2) Made NO relief appearances during the season,
3) Pitched from 1960 to 2013, and
4) Had an ERA between 3.50 and 3.60.
Group A was just the same as group B, except that the ERA cutoffs were 2.90 and 3.00, and Group C was just the same except that the ERA cutoffs were 4.10 and 4.20. The study was exhaustive, rather than selective; that is, it included ALL pitchers who qualified for Group A, rather than a select list of pitchers who qualified for Group A. There were 105 starting pitchers in Group A, who made a total of 2,997 starts. There were 123 starting pitchers in Group B, who made a total of 3,340 starts, and there were 110 pitchers in Group C, who made a total of 2,805 starts.
I then focused on attempting to score how tired each pitcher might be, based on two data points: How long it had been since his last start, and how many batters he had faced in his previous start, plus 5. (My data doesn’t actually have BFP, Batters Faced, in each start. It does, however, have outs records, hits allowed and walks allowed, so technically we are scoring each pitcher’s workload fatigue based on outs, hits and walks, rather than on batters faced. But perhaps you will allow me to refer to the sum of these three events, +5, as batters faced.)
OK, I made a "fatigue score" for each pitched, which was
100 points, plus
4 points for each day since the pitcher’s previous start, minus
2 points for each batter faced (+5) in the previous start,
But not more than 100.
So, for example, Gary Bell started on July 5, 1961, getting 12 batters out, giving up 8 hits and walking 2. We count that as 27 batters faced—assuming that there is some "fatigue cost" simply to getting on the mound. He didn’t pitch again until July 16, 1961—11 days later, probably after the All Star break—so that makes a "Freshness Score" of 90—
100, plus
44 for the 11 days between starts (11 times 4), minus
54 for the batters he had faced in the previous start (22 plus 5, times 2).
The Freshness Score goes up with additional days off, and goes down with additional batters faced in the previous start.
Matt Clement started on May 5, 2003, going 6 innings, giving up 8 hits and 1 walk. He did not pitch again until May 16, again an 11-day gap. His freshness score is 80—100, plus 44, minus 64.
Aaron Cook started on April 18, 2009, going 4 innings, giving up 8 hits and 2 walks. He started again six days later, April 24. That makes a freshness score of 70—100, plus 24, minus 44.
Kevin Correia started on May 9, 2013, going 5 and a third innings, giving up 9 hits but no walks. He started again on May 14. That makes a freshness score of 60—100, plus 20, minus 60.
Richard Dotson started on June 6, 1987, pitching a complete game, giving up 5 hits and 2 walks. He started again on June 13. That makes a freshness score of 50—100, plus 28, minus 78. (The average Freshness Score in this study is about 56.)
Chuck Finley pitched on September 7, 1988, pitching 7.2 innings, giving up 9 hits and 5 walks. He pitched again on September 13. That makes a freshness score of 40—100, plus 24, minus 84.
Mickey Lolich pitched on April 30, 1974, pitching a complete game, giving up 8 hits and 3 walks. He pitched again on May 4. That makes a freshness score of 30—100, plus 16, minus 86.
Bert Blyleven pitched on April 16, 1975, pitching a complete game, giving up 10 hits and 6 walks. He started again on April 20. That makes a freshness score of 20—100, plus 16, minus 96.
Ken Holtzman pitched on September 17, 1973, pitching 12 innings, giving up 8 hits and 4 walks. He started again on September 21. That makes a freshness score of 10—100, plus 16, minus 106. (He was shelled in his next start.)
No one in my study had a Freshness Score of exactly zero. Luis Tiant, however, started June 14, 1974, pitching 14 and a third innings, giving 11 hits and 4 runs. He started again on June 19. That makes a freshness score of Negative 6—100, plus 20, minus 126. (Tiant was up for it. He pitched great on June 19, and pitched extra innings AGAIN—10 innings, 3 hits, 1 run.)
OK, then I studied the Freshness Scores, which, as I mentioned, center at 56. I used this scale:
Freshness Score 66 or higher—Group 5 (most fresh pitchers)
Score of 58 to 66—Group 4 (above average)
Score 52 to 56—Group 3 (average fatigue)
Score 46 to 50—Group 2 (above average fatigue)
Score 44 or below—Group 1 (Most fatigued pitchers, or least fresh)
First Results
To cut to the chase, the study shows fairly clearly that pitchers are most effective when they are most fresh, and do lose effectiveness with more work.
There are three groups of pitchers in the study—Group A, with ERAs very close to 2.95, Group B, with ERAs centered at 3.55, and Group C, with ERAs of about 4.15. All three groups of pitchers were more effective when they were more fresh. The effects are not huge, and they are not perfectly consistent, but. . ..I think they’re real.
Group A, the pitchers with an ERA of 2.95, had an ERA of 2.89 when they were most fresh, 2.85 in the second freshness group, and 2.78 in the "central" group. Their overall ERA rose to 3.13, however, in Group 2, and to 3.15 in Group 1. Their ERAs rose by essentially a quarter of a run when they were more tired. There are at least 542 pitcher starts in each subgroup of this part of the study:
| |
|
GS
|
IP
|
W
|
L
|
WPct
|
H
|
R
|
ER
|
SP
|
BB
|
ERA
|
|
A
|
5
|
542
|
3618
|
260
|
132
|
.663
|
3029
|
1292
|
1161
|
2618
|
1103
|
2.89
|
|
A
|
4
|
665
|
4525
|
343
|
182
|
.653
|
3890
|
1578
|
1431
|
3338
|
1331
|
2.85
|
|
A
|
3
|
734
|
5141.1
|
377
|
195
|
.659
|
4357
|
1764
|
1590
|
3857
|
1525
|
2.78
|
|
A
|
2
|
687
|
4846.2
|
322
|
208
|
.608
|
4326
|
1891
|
1686
|
3481
|
1394
|
3.13
|
|
A
|
1
|
911
|
6566
|
438
|
295
|
.598
|
5986
|
2574
|
2300
|
4328
|
1893
|
3.15
|
Group B, the pitchers with ERAs of 3.55, had a slightly smaller loss of effectiveness with more work, but still had ERAs of 3.42 and 3.51 in the two "most rested" groups, as opposed to 3.65 and 3.59 in the two "Most tired" categories.
|
|
|
GS
|
IP
|
W
|
L
|
WPct
|
H
|
R
|
ER
|
SP
|
BB
|
ERA
|
|
B
|
5
|
676
|
4383
|
299
|
202
|
.597
|
4082
|
1851
|
1665
|
2934
|
1423
|
3.42
|
|
B
|
4
|
865
|
5641.1
|
329
|
306
|
.518
|
5407
|
2484
|
2202
|
3955
|
1745
|
3.51
|
|
B
|
3
|
929
|
6202.1
|
383
|
304
|
.557
|
5948
|
2730
|
2460
|
4333
|
1892
|
3.57
|
|
B
|
2
|
689
|
4622
|
318
|
226
|
.585
|
4426
|
2063
|
1872
|
3005
|
1416
|
3.65
|
|
B
|
1
|
857
|
5995
|
377
|
315
|
.545
|
5756
|
2678
|
2393
|
3575
|
1849
|
3.59
|
Group C, the pitchers with ERAs around 4.15, has some out-of-line data, but still has an ERA of 3.99 in Freshness Group 4, as opposed to 4.27 in Group 1:
|
|
|
GS
|
IP
|
W
|
L
|
WPct
|
H
|
R
|
ER
|
SP
|
BB
|
ERA
|
|
C
|
5
|
735
|
4480.2
|
267
|
258
|
.509
|
4543
|
2310
|
2104
|
2877
|
1565
|
4.23
|
|
C
|
4
|
974
|
6077
|
364
|
351
|
.509
|
6074
|
2981
|
2696
|
3916
|
2014
|
3.99
|
|
C
|
3
|
831
|
5225.1
|
318
|
299
|
.515
|
5354
|
2678
|
2464
|
3321
|
1640
|
4.24
|
|
C
|
2
|
526
|
3388
|
204
|
189
|
.519
|
3491
|
1698
|
1534
|
2142
|
1158
|
4.07
|
|
C
|
1
|
474
|
3137.1
|
171
|
199
|
.462
|
3289
|
1651
|
1489
|
1852
|
1057
|
4.27
|
All three groups have winning percentages approximately 50 points higher when the pitcher is most rested as opposed to when he is most tired (65 points in Group A, 52 points in Group B, 47 points in Group C.)
In all three groups, the ERA of pitchers in Rest Group 5 is lower than the ERA of pitchers in Rest Group 1 (16 points lower on average), and in all three groups, the ERA of pitchers in Rest Group 4 is lower than the ERA of pitchers in Rest Group 2 (17 points lower on average).
Second Study
While I had the data I needed isolated, I did a second study related to the same issue, but focused on cumulative fatigue—actually cumulative workload—rather than the effects of one start. In this study, every starter has a "full tank score" of 1000 in their first start of the season. For each subsequent start, however, his full tank score would be:
The score from his previous start,
Plus 22 points for each day that has passed since that start,
Minus 7 points for each batter faced in the previous start, in excess of 18,
Plus or minus 5% of the difference between the previous game score and 700.
For "Batters Faced in the Previous Start", as I did before, I added 5 batters, so that 7 points for each batter above 18 is actually 7 points for each batter faced above 13. To illustrate how these numbers work in practice, let’s look at Mickey Lolich in 1971.
Mickey Lolich in 1971 had a famous season in which he made 45 starts, pitched 376 innings, and went 25-14 with a 2.92 ERA—one of the hardest-working seasons in modern baseball history. He happens to fall into one of my three groups, since he had no relief appearances and an ERA between 2.90 and 3.00. This is a log of his appearances in that season:
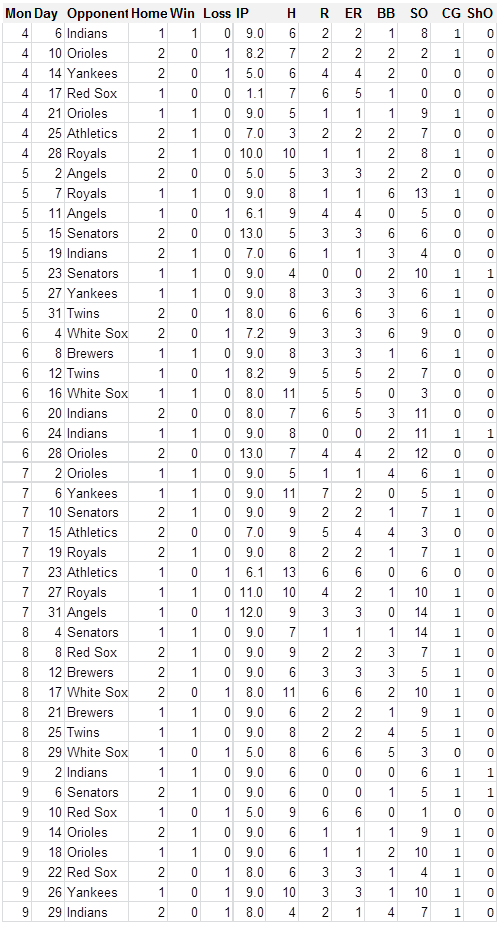
Lolich pitched 13 innings in a game twice that season. On July 27 and 31, he pitched 11 and 12 innings in consecutive starts, then followed that up with 6 straight complete games from August 4 through August 25.
The first thing we do with that log is to extract from it Lolich’s Batters Faced in each start, and the days between starts. We figure batters faced, again, as outs recorded, plus hits allowed, plus walks allowed, plus 5. This creates the log below, derived from the one above:

OK, his "Cumulative Fatigue Score" for the first start is 1000, since that is his first start of the season. For his second start, it is
1000,
Plus 88 for the four days since his previous start,
Minus 147 for the 39 batters he faced in his previous start,
Minus 5% of the difference between 1000 and 700.
That makes 926. His "Cumulative Fatigue Score" for his second start of the season is 926. These are his scores for each start all season:
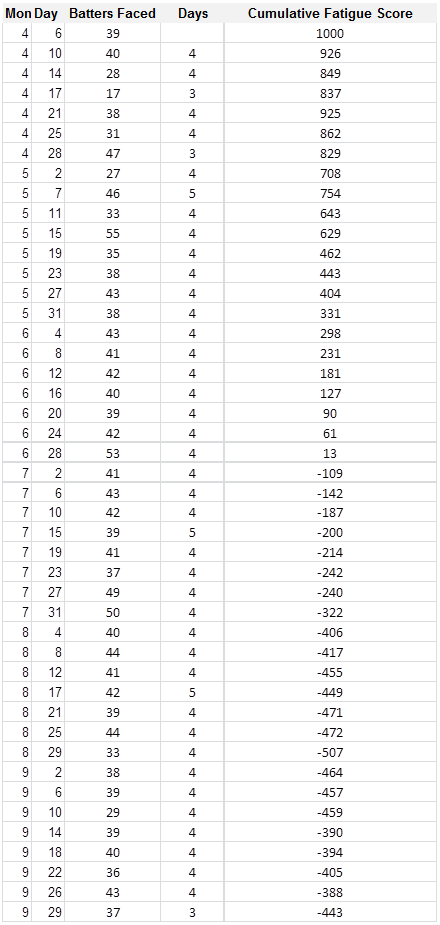
Obviously Lolich in 1971 had an extremely unusual work schedule, and because of that these are highly unusual numbers. Lolich’s score for his second start of the season was 926. Some modern pitchers, working with an extra day of rest and facing fewer batters per start, don’t get as low as 926 at any point in the season. Here are the scores for Jeremy Hellickson in 2011:
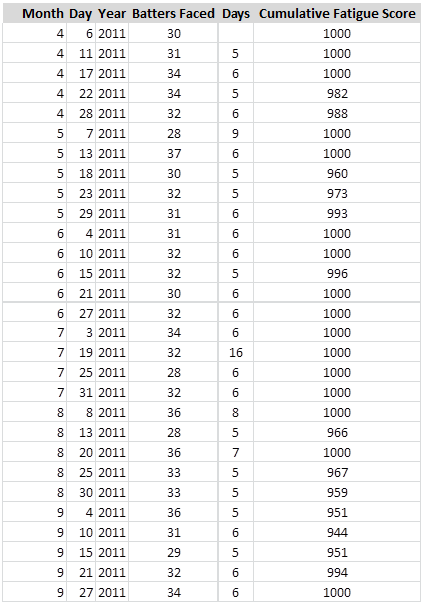
The "700 correction" was put into the system for two reasons. First, without the 700 correction many modern pitchers, like Hellickson, tend to "hang around" 1000 all season. This seems to me not entirely realistic. A pitcher working in the rotation, even being handled super-carefully as modern pitchers sometimes are, still is not the same as he was on opening day; we still have to assume that there is SOME arm fatigue occurring there. Second, a few pitchers—like Lolich in 1971—never get much rest, never get as much rest as this system assumes they need, and only go lower and lower and lower over the course of the season. This also is not entirely realistic; at some point the system needs to stabilize. It can stabilize at a very low number, but if that’s how he’s used and he is able to perform in that way, then that’s a stable situation rather than a situation of constant deterioration.
Putting in a "correction" that constantly tends to move the number in the direction of some central number—700—encourages the development of a stable platform in the scores, in those unusual situations. Lolich gets to negative 400 by early August, but then his number stabilizes, rather than continuing to zoom downward, in large part because it is being adjusted upward by 50+ points each start by the 700 correction. Which is more realistic, because it is apparent that Lolich CAN perform at the level he is performing at with that workload.
Not very many pitchers in the study ever get into the negative range for scores; I would have preferred that NONE did, but I can’t tinker with the system forever. Only pitchers who have very high workloads, even for the old-time 4-man rotations with many complete games. . ..only those who have heavier-than-normal workloads ever verge into the negative scores. But the -507 reach by Lolich on August 29, 1971, is actually not the lowest number in the study. Wilbur Wood, 1974, is in the study, and he reaches a low of -510.
But as Lolich’s work schedule is very unusual, so too is Hellickson’s; not many pitchers, even now, are used AS carefully as Hellickson was in 2011.
Second Results
In this study, even more than in the other one, it is apparent that starting pitchers lose some effectiveness when they work harder. I summarized the data in this way:
Score of 950 or Higher Group 10
Score of 850 to 949 ; Group 9
Score of 750 to 849   Group 8
Score of 650 to 749 Group 7
Score of 550 to 649 Group 6
Score of 350 to 549 Group 5
Score below 350 Group 1
Despite the Lolich example—very unusual—there aren’t very many pitchers in the study whose Freshness Scores ever drop below 400, so making groups for each smaller ranger would only yield erratic small-sample data. . ..I assume; I didn’t actually do that; I just saw that there were not enough starts to make stable averages in those groups, so I didn’t look at the averages.
Anyway, let’s deal with Performance Group A, which is the pitchers who had ERAs of 2.90 to 3.00. We can see that their ERA is 2.87 when they are completely rested, but rises to about 3.20 when they have been worked harder:
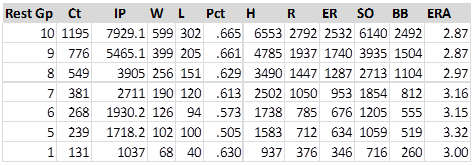
Performance Group B is those pitchers with ERAs of 3.50 to 3.60, and here again we see a clear pattern of loss of effectiveness when pitchers are worked harder:
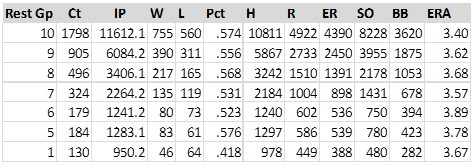
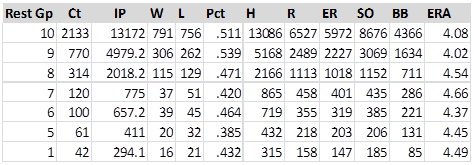
And again, only more dramatically, in Performance Group C:
Analysis
Three questions:
1) Is this study definitive?
2) Is the effect being fully measured?
3) Does this change my conclusion in this area.
1, Is the study definitive—it is not. The study would be definitive if we had an absolutely consistent 1-2-3-4-5 pattern in all three groups, or if the study was so overwhelmingly large that it removed all doubt, or if I had studied all 15 to 20 cadres of pitchers who could be studied, rather than three of them, or if someone else had repeated my process with some different but parallel set of parameters and confirmed my conclusions. Lacking any of those things, there is room to argue.
But the study is pretty convincing. Performance Group B is a study of more than 3,000 starts and more than 25,000 innings. That alone is fairly persuasive. When essentially the same pattern can be seen in two other groups pf pitchers, I don’t have a lot of doubt about whether the same pattern would appear in a 4th group or a 5th or a 6th. I’m pretty much convinced.
Point 2, awkwardly stated. . ..obviously the underlying pattern must be larger than the estimate that I have made of it. This is true, first of all, because it is ALWAYS true; one only captures a full effect with a perfect study. If I PERFECTLY defined the categories so that I captured EXACTLY when pitchers were tired, I would get a full effect; since I have merely a guesswork approximation of that, obviously I would not capture the full effect.
But also, it is obvious that there are biases inherent in the study which are reducing the measured effect. You may note, in the charts above, that the "A" pitchers, with a 2.95 ERA, pitched most often when they were most tired, whereas the "C" pitchers, with a 4.15 ERA, pitched most often when they were most rested. If we assume
a) that there is a "fatigue effect" which increases the ERA of pitchers when they are overworked, and
b) that the most effective pitchers are the most likely to be overworked,
then we can conclude that the "A" pitchers are actually more effective than we have measured them as being, consequently that the differences in effectiveness are greater than we have measured them as being.
And obviously, assuming that pitchers CAN be over-rested as well as over-worked, then there must be a U-shaped "effectiveness curve", where the ERA is lowest when the rest level is MOST appropriate. If that’s true then the effects would expand rapidly as you get out of the bottom or "cup" of the U-shaped curve. Obviously managers are trying to stay WITHIN the effective range, and all we can measure is their accidental failures, the times when THEY miscalculated and used pitchers ineffectively. Obviously this portion of the curve is merely a tiny portion of the total effect.
3) As to whether this changes my opinion on the underlying issue. … yes, absolutely it does. My argument against the five-man rotation was this. When you switch from a four-man to a five-man starting rotation, over the course of a season you are taking 8 starts away from your #1 starter, 8 starts away from you r number 2 starter, 8 starts away from your #3 starter, and 8 starts away from your #4 starter, and you are giving all 32 of those starts to your number five starter. I wouldn’t do that unless I saw clear and convincing evidence of some offsetting benefit.
But look at the data. Let’s assume that your #1 starter has an ERA of 3.00, your #2 starter, 3.50, #3 starter 4.00, #4 starter 4.50, #5 starter 5.00. If you use a four-man rotation you have a starting pitcher ERA of 3.75; a five-man rotation, 4.00. There’s a loss there of 0.25 runs per game.
But this study suggests that the gains in ERA are of essentially the same magnitude—25 hundredths of a run a game for a "rested" pitcher as opposed to a tired pitcher. So then it’s a fair fight—and my theoretical example could be overstated; I don’t know that, on the average team, the #5 starter has an ERA two runs a game higher than the #1 starter.