8. The Won-Lost Record is 50% Luck
Going back now to the thing that I didn’t know, which was that outstanding pitchers basically pitch well in 100% of their starts, or something very close to 100%; this was Part 4 of yesterday’s series of articles.
My next thought, realizing that, was that winning percentages might be looked at as 50% luck, 50% a measure of how often the pitcher has pitched well. If you think about it, truly dominant pitchers very often have winning percentages around .750. .750 is the half-way point between always pitching well—1.000—and random luck--.500.
Well, I thought, maybe I could study that issue. If a group of pitchers pitches well in 80% of their starts, what is their winning percentage?
If a pitcher’s won-lost record was 50% luck and 50% a result of pitching well, then a pitcher who pitched well in 80% of his starts would have a .650 winning percentage. If he pitched well in 70% of his starts, he would have a .600 winning percentage. ..get it?
And, in fact, this works phenomenally well. Suppose that we take all of the pitchers in my data, and arrange them in declining order of "Good Game Percentages". The top 500 pitchers in Good Game Percentage have a combined Good Game-Bad Game total of 1364 – 54, a .962 "Good Game Percentage". If the theory is correct, they should have a winning percentage, in their charged decisions, of .731.
It’s .722. Just .009 from the theoretical number. Most of those top 500 are guys who only had one start and pitched well in their one start, so that’s not a large sample even though there are 500 pitchers included. Let’s do the top 1,000.
The top 1,000 pitchers in terms of the percentage of their starts that were good starts had a total of 10,702 good starts, and 2,470 bad starts. That’s a "Good Start Percentage" of .812. If the theory works, their actual, real-life winning percentage should be about .656.
And it actually is .656. No shit; it works perfectly.
As we move down the list, the group of 1,000 pitchers who have a Good Game Percentage of .800 do in fact have a Winning Percentage of exactly .650.
The group of 1000 pitchers who have a Good Game Percentage of .750 should have a Winning Percentage of .625. It is actually .630.
The group of 1000 pitchers who have a Good Game Percentage of .700 should have an aggregate winning percentage of .600. It is actually .603.
This is a chart summarizing these type of data points—in all cases based on groups of 1,000 pitcher/seasons:
|
Good Game Percentage
|
Winning Percentage
|
|
.812
|
.656
|
|
.800
|
.650
|
|
.750
|
.630
|
|
.700
|
.603
|
|
.650
|
.585
|
|
.600
|
.561
|
|
.550
|
.522
|
|
.500
|
.485
|
|
.450
|
.465
|
|
.400
|
.433
|
|
.350
|
.395
|
|
.300
|
.372
|
|
.250
|
.330
|
|
.200
|
.291
|
|
.150
|
.255
|
|
.100
|
.231
|
|
.050
|
.195
|
|
.000
|
.135
|
A couple of points here. First, this is data for groups of pitchers—not for individual pitchers. For a group of 1000 pitchers, we can assume that the luck has evened out—not entirely, but largely.
An individual pitcher who has a Good Game Percentage of .800 cannot be expected to have a winning percentage of .650, because you cannot assume that his luck will be .500. His luck might be .600—in which case he will have a winning percentage of .700—or his luck might be .400, in which case he will have a winning percentage of .600. Luck only evens out for large groups of pitchers.
Second, the theory that a pitcher’s record is 50% a result of his Good Game Percentage and 50% a result of his luck, when you think about it, cannot be perfectly true, because a pitcher’s universe is not symmetrical. A pitcher who pitches extremely well cannot allow fewer runs than zero, but a pitcher who pitches badly can allow a very large number of runs to score. Because this is true, the "luck component" cannot be equal to the "performance component" at both ends of the scale. The pitcher who pitches really, really badly all of the time cannot win 25% of his games by luck, because the importance of luck—assuming that it is randomly distributed—cannot be equal to the importance of performance on both ends of the scale, since the pitcher’s universe is asymmetrical. Does that make sense?
Let me try to explain that again. If you pitch well, average luck may cost you 25% of your wins, and bad luck may cause you to lose more than 25% of your games. But if you pitch badly—really badly—then luck isn’t going to win the game for you 25% of the time, because the difference between average pitching and bad pitching is larger than the difference between average pitching and good pitching.
Still, I am very taken by the notion that a pitcher’s won-lost record is 50% performance, and 50% skill; it is a neat way to think about the problem, and the data demonstrates that it is essentially true. If you pitch well 70% of the time, you should win 60% of your decisions
.
9. Quality of Opposition (Career)
I have mentioned this before, I know, but when I was in college I used to argue with my friend Tony Bandle about the relative merits of Bob Gibson vs. Juan Marichal; I would argue for Marichal and Tony, who was from St. Louis, would object vigorously. One of Tony’s arguments was that Marichal pitched more often against the weak sisters of the National League—the Mets, the Astros, the Cubs—whereas Gibson did not.
This argument is untrue; Gibson in his career had an opposition winning percentage of .495; Marichal, of .496. A pitcher who pitches on good teams tends to draw slightly sub-.500 opponents, but only slightly. But the larger question here isn’t Gibson vs. Marichal or "Don’t you have homework to do?", it is whether the quality of opposition is a legitimate variable over the course of a career.
It is not. It’s not an absolute zero, of course, but. . .it’s not a meaningful variable. In my data, all of the pitchers who have the most extreme opposition winning percentages are a) pitchers from the 1950s, for whom we have gaps in the data which are not uniformly centered around .500, and b) pitchers who didn’t have very many starts. Among pitchers for whom we have full-career data, the highest opposition winning percentage for any pitcher with 200 or more starts is .516, for Pedro Ramos; well, Rodrigo Lopez is a higher .516 than Ramos, but I’m treating Lopez as still active, because I’m not sure whether he is or isn’t. Anyway, it’s an .016 "problem" is the most extreme case; on the other end is Tony Cloninger, facing .484 opposition in about the same number of starts. The standard deviation of opposition winning percentage, career, for pitchers with 100 or more starts is .007; with 200 or more starts, .005; and with 300 or more starts, .004.
As to what that means in terms of an ERA disadvantage. . .a 16-point advantage is opposition winning percentage is roughly equivalent to a 16-point advantage in ERA (0.16). If you think about it, a team that outscores its opponents by one run per game, at normal levels of offense, has about a .600 winning percentage, so .100 in winning percentage = 1.00 runs; thus, .050 in winning percentage is roughly equal to 0.50 runs, and .020 in winning percentage is roughly equal to 0.20 in runs.
With modern computers we can easily track the opposition winning percentage, thus easily adjust for it in our evalautions of players, so. . .why not? If we’re going to adjust for everything, we have to adjust for everything we can document. Still, it’s not a meaningful variable over the course of a career.
10. Steve Carlton, 1980
The pitcher whose Good Game-Bad Game record was 34-1 was Steve Carlton in 1980. 1980 wasn’t Carlton’s best season; 1972 was the year he went 27-10 with a 1.97 ERA for a turable team. In 1980 he was with the World Champions, but he was a mere 24-9 with 286 strikeouts and a 2.34 ERA. ‘
Let’s look at his nine losses that year. Against the Mets on April 21 he pitched 7 innings, giving up only 5 hits and 2 runs, but lost the game (3-0) as the Phillies were shut out. That’s a Game Score of 62, a Compensation Score (based on the opposition and run context) of 8.9, total of 70.9; we score that game an "8", but it was a loss.
May 10 against the Reds, matched up against Tom Seaver in Cincinnati; Carlton pitched 7 innings, only 4 hits, 11 strikeouts, 4 runs, 3 earned. Game Score was 62, Compensation Score of 8.6; again, that’s an "8", but a 5-3 loss.
Carlton didn’t lose again until June 27; by that time he was 13-2. On June 27, again facing the Mets in Veterans Stadium, he pitched 7 innings, 8 hits, 3 runs, 6 strikeouts, no walks. Game Score of 55, Compensation Score of 8.9, total of 63.9. It’s a "6" effort on a 10-point scale, but he lost the game 3-2.
His next start, July 2, facing Steve Rogers of the Expos, he was hit hard for the only time all season; 7 1/3 innings, 7 hits, 6 runs all earned, walked 6 batters. Game Score of 39, Compensation Score of 7.7. We score that game "2" on a 10-point scale, and he took a 6-1 loss.
July 27 against the Reds in Riverfront again, matched up against Mario Soto, who was a great pitcher, too, but only for a few years. Carlton had a borderline Quality Start—6 innings, 3 runs, 2 earned. Game Score of 53; in our system it’s a "5"—neither a good effort nor a bad one—but he lost the game, 3-2.
August 2 against the Reds, again; he pitched 8 innings, 7 hits, 2 runs, 10 strikeouts. We score the game an "8", but he lost it 2-1.
August 22 against the Giants, he pitched 10 innings and struck out 13 batters; again, we score the game an "8", but he lost 4-3.
September 5 at Dodger Stadium, Carlton gave up 1 run in 7 innings, lost the game 1-0 as Don Sutton was outstanding. We score Carlton’s game, again, as an "8".
September 27 at Montreal; the pennant race is still on. The Phillies come into the game 85-68; the Expos, 84-70, a game and a half back with 8 to play. Carlton is so-so; 7 innings, 7 strikeouts, one walk, but gives up 4 runs and loses, 4-3. We score the game as a "6". His last five losses were by scores of 1-0, 2-1, 3-2, 4-3, and 4-3.
That’s the nine losses; altogether in the 9 losses he pitched 66.1 innings—about 7 and a half innings per start—gave up 61 hits, struck out 68, walked 26 and had a 3.53 ERA. We scored one of them a "2"—a bad game—and one a "5"—a neutral game. Otherwise, he pitched well.
11. 18-11
Suppose that a pitcher in a season made 29 starts in a season, went 18-11 with a 1.69 ERA. Not a bad year, huh?
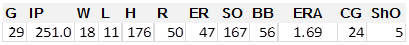
251 innings, 24 complete games, 5 shutouts.
That’s Gaylord Perry’s record in 1972 against teams that had .500 or better records. He also made another 11 starts against teams with sub-.500 records.
12. 1975 Dodgers
What is the best starting rotation of the last 50 years?
Other methods have other answers, but the list suggested by this method is as follows:
5. 2002 Arizona Diamondbacks. They had the two best starting pitchers in baseball, Randy Johnson and Curt Schilling, and they won 98 games. We credit them with a Good Start/Bad Start ratio of 103-51.
4. 1997 Atlanta Braves. Maddux, Glavine, Smoltz, and Neagle. 103-46.
3. 2013 Detroit Tigers. Verlander, Scherzer, Anibal Sanchez and Mister Fister. It was just last year; you probably remember it. 104-48.
2. 1998 Atlanta Braves. 104-45.
1. 1975 Dodgers.
OK, that one’s a little unexpected.
The 1975 Dodgers were a good team. They won 88 games, and they led the majors in ERA, at 2.92. The starting rotation was Don Sutton—a Hall of Famer—Andy Messersmith, Doug Rau, and Burt Hooton.
Still, I didn’t expect to see them at the very top of the list. According to this method, they pitched well 107 times, poorly 43 times—as opposed to the 1966 Dodgers, who were still very good, at 93-59, but actually nowhere near as good as the 1975 Dodgers.
Here is a list of the 10 best starting pitchers in the National League in 1975, as ranked by the sum of the values of all of the pitcher’s starts:
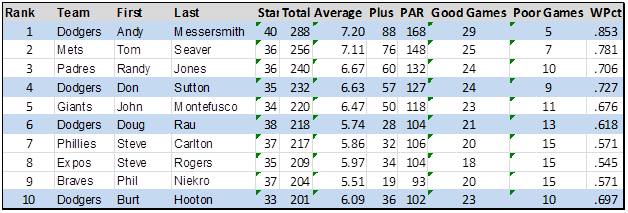
Tom Seaver won the National League Cy Young Award in 1975, and obviously Seaver was a great pitcher, but I think the conclusion that Andy Messersmith was actually the best pitcher in the league that season is probably not surprising. Messersmith didn’t win the Cy Young Award because his won-lost record was just 19-14, but he pitched more innings than Seaver with a better ERA.
The worst starting rotations in my data are:
5. 2005 Kansas City Royals. 46 Good Starts, 99 Bad Starts, team record 56-106.
4. 2003 Cincinnati Reds. 45 Good Starts, 100 Poor Starts; team record 69-93.
3. 1984 San Francisco Giants. 45 Good Starts, 104 Poor Starts, team record 66-96.
2. 2013 Minnesota Twins. 44 Good Starts, 103 Poor Starts; team record 66-96.
1. The 1996 Detroit Tigers. 44 Good Starts, 106 Poor Starts; team record 53-109. Omar Olivares led the team in wins, with 7, and in ERA, 4.89. Three other pitchers made 15 or more starts for them: Felipe Lira (6-14, 5.22 ERA), Brian Williams (3-10, 6.77) and Greg Gohr (4-8, 7.17).
13. Don Drysdale, 1964
Here’s a borderline incredible fact for you. Don Drysdale made 40 starts in 1964, and the Dodgers outscored their opponents in those starts, 171 to 116—but lost 21 of the 40 games. When you outscore your opponents by that margin you should go 28-12; they went 19-21.
Drysdale lost four 1-0 games that year, which is a big deal; not very many pitchers have ever lost four 1-0 games in a year. There was also one game in which Drysdale pitched ten shutout innings, left the game, and the bullpen lost it, 1-0.
In addition to the 1-0 losses, they also lost one game 2-1 (in 15 innings), lost 3-2, and lost four games by the score of 4-3; that is 11 one-run losses, if you’re counting. They lost a game 6-5; that’s 12.
They lost 2-0, 4-2, and 3-1, so that’s 15 one- or two-run losses. On the other hand, they won games started by Drysdale by scores of 6-0, 7-1, 9-1, 5-0, 10-3, 6-1, 5-0 again, 5-1, 15-4, 6-2, 9-0, 12-3 and 8-1.
14. Nolan Ryan and John Halama
We have won-lost records for each pitcher, and we have in this method a very careful count of how often each pitcher has pitched well. It is therefore possible, for each pitcher, to measure the discrepancy between his wins and losses, and his "Good Games/Bad Games" totals.
I don’t want to get too much into this, because we have talked about lucky and unlucky pitchers many times before, and we don’t need to go over that again, and also this is not an article about won-lost records; it is about how well pitchers have actually pitched. Won-lost records are strictly incidental, but we’ll give the topic just a moment.
Steve Carlton in 1980 was 24-9, but had a Good Game Record of 34-1, so his record was nine games short of how often he actually pitched well. Andy Messersmith in 1975 was 19-14, but he had a Good Game Record of 29-5, so he was nine and a half games short comparing one to the other. These actually are both historic margins. There are not very many pitchers in the data who are nine or ten games short of the won-lost record that they arguably deserve.
Third quibble: the Good Game Record is not exactly a measure of how often the pitcher deserved to win. We are trying to measure how often the pitcher pitched well, under the circumstances, which is similar to how often he deserved to win, but not exactly the same. Also, since we treat only "5s" as no-decisions, pitchers have more Good Games and Bad Games than they have Wins and Losses; the Good Game Records might match the Won-Lost records better if I ignored 4s, 5s and 6s, rather than just 5s. But as I said, won-lost records aren’t the main focus here, so charging ahead. . . .
The unluckiest pitcher in our data, by this method, is not a surprise; it is Nolan Ryan with the 1987 Astros. Ryan pitched 212 innings, struck out 270 batters and led the league in ERA—but finished 8 and 16. His Good Game Record was 25-4, so his won-lost log is 14 and a half games worse than his Good Game Record. These are the 18 pitchers who finished at least ten games below divine justice:
|
Year
|
First
|
Last
|
Won
|
Lost
|
Good Games
|
Bad Games
|
Shortfall
|
|
1987
|
Nolan
|
Ryan
|
8
|
16
|
25
|
4
|
14.5
|
|
1964
|
Don
|
Drysdale
|
18
|
16
|
33
|
7
|
12
|
|
2004
|
Ben
|
Sheets
|
12
|
14
|
27
|
5
|
12
|
|
1963
|
Roger
|
Craig
|
5
|
21
|
18
|
11
|
11.5
|
|
1977
|
Jerry
|
Koosman
|
8
|
20
|
20
|
9
|
11.5
|
|
1992
|
Jim
|
Abbott
|
7
|
15
|
20
|
6
|
11
|
|
1977
|
Nolan
|
Ryan
|
19
|
16
|
30
|
5
|
11
|
|
1982
|
Mario
|
Soto
|
13
|
13
|
27
|
5
|
11
|
|
1984
|
Fernando
|
Valenzuela
|
12
|
17
|
24
|
7
|
11
|
|
1992
|
Melido
|
Perez
|
13
|
16
|
23
|
5
|
10.5
|
|
1967
|
Gaylord
|
Perry
|
15
|
16
|
28
|
8
|
10.5
|
|
1972
|
Gaylord
|
Perry
|
24
|
16
|
34
|
5
|
10.5
|
|
1986
|
Mike
|
Scott
|
18
|
10
|
33
|
4
|
10.5
|
|
1967
|
Jim
|
Bunning
|
17
|
15
|
30
|
8
|
10
|
|
1996
|
Roger
|
Clemens
|
10
|
13
|
24
|
7
|
10
|
|
1993
|
David
|
Cone
|
11
|
14
|
24
|
7
|
10
|
|
1962
|
Turk
|
Farrell
|
8
|
17
|
19
|
8
|
10
|
|
1969
|
Bob
|
Gibson
|
20
|
13
|
30
|
3
|
10
|
I have made lists of unlucky seasons many times, but I think that’s the best list of Tough Luck Seasons I have ever made. A few notes:
Bob Gibson in 1969 was actually unluckier than he was in 1968, when he lost 9 games despite posting a 1.12 ERA. In 1968 his Good Game Record is 30-1, so his won-lost record (22-9) is eight games short. In 1969 it is ten games short.
Mike Scott won the Cy Young Award in 1986 despite a won-lost record that was 10 and a half games short of what he may have deserved. . . understanding that luck is a normal part of the game, and that a pitcher who has a Good Game record of 33 and 4 is not normally going to go 33 and 4.
We could say that the Cy Young voters saw through Scott’s bad luck in 1986, but the Boston Red Sox failed to see through Clemens’ bad luck ten years later. Clemens pitched extremely well his last year in Boston—24 Good Games, 7 Bad—but the team didn’t see it. They failed to see through it, I think, because Clemens had had several years of bad luck by that time, and, while an awareness of the flaws of won-lost records was growing by 1996, that awareness was not yet strong enough for people to accept that not only doesn’t run support even out over the course of a season, it doesn’t always even out over the course of four or five seasons, either.
The most famous Tough Luck season which isn’t on the list is Dave Roberts in 1971; he was 14-17 with a 2.10 ERA. We have him with a Good Game Record of 21 and 8.
On the other side of this highway would be John (Is Your Mama?) Halama with the 2000 Seattle Mariners. Halama was 14-9 despite a Good Game Record of 3-22:
|
Year
|
First
|
Last
|
Won
|
Lost
|
Good Games
|
Bad Games
|
Good Fortune
|
|
2000
|
John
|
Halama
|
14
|
9
|
3
|
22
|
12
|
|
2009
|
Braden
|
Looper
|
14
|
7
|
7
|
21
|
10.5
|
|
1953
|
Russ
|
Meyer
|
15
|
4
|
11
|
20
|
10
|
|
1977
|
Paul
|
Splittorff
|
16
|
6
|
13
|
22
|
9.5
|
|
1990
|
Bob
|
Welch
|
27
|
6
|
17
|
13
|
8.5
|
|
1989
|
Storm
|
Davis
|
19
|
7
|
13
|
17
|
8
|
|
2005
|
Mark
|
Hendrickson
|
11
|
8
|
6
|
19
|
8
|
|
1982
|
Phil
|
Niekro
|
17
|
4
|
15
|
18
|
8
|
|
2006
|
Steve
|
Trachsel
|
15
|
8
|
8
|
17
|
8
|
|
2004
|
Ismael
|
Valdez
|
9
|
6
|
2
|
15
|
8
|
|
1971
|
Chuck
|
Dobson
|
15
|
5
|
11
|
16
|
7.5
|
|
2003
|
Ramon
|
Ortiz
|
16
|
13
|
8
|
20
|
7.5
|
|
2011
|
Brad
|
Penny
|
11
|
11
|
5
|
20
|
7.5
|
Not only does Halama show up as the luckiest bastard in the pool, but the 3-22 Good Games Record is also the worst in the data, 20 or more starts. (Well, three guys went 2-15. 2-15 is a worse percentage than 3-22.) Halama had a lot of "4" games. . . .a lot of games that we are counting as Poor Starts, but they weren’t terrible. In the 11 games that Halama "won" but did not pitch well he pitched 63.1 innings with a 4.41 ERA, and the Mariners outscored their opponents 92 to 50.
Other notes: No pitcher shows up on both the "Tough Luck" list (above) and the "Good Luck" list (not so far above.) Phil Niekro had several tough-luck seasons, but none of them quite made the list.
Bob Welch is the only pitcher on the super-lucky list who won the Cy Young Award, just almost totally based on luck. (Sorry, Bob. This was written before you died.)
Most of the "Good Luck" pitchers got a hard dose of reality the next season. Storm Davis, 19-7 in 1989, was 7-10 the next season. Mark Hendrickson, known affectionately in our house as Mark the Giant, followed up his lucky season with a 6-15 campaign. Braden Looper, known affectionately as Braden (Pooper) Looper, never pitched in the majors after 2009. Ramon Ortiz, 16-13 in 2003, was knocked out of the rotation early in 2004, winning 5 games on the season.
Halama, however, continued to roll. He was 10-7 in 2001, and didn’t pitch much better then than he had in 2000.