Strikeouts are up a record amount, and the analytics seem to indicate it doesn’t matter as long as you hit home runs. But how does this approach fare in the playoffs- when it really matters most. Not only are the stakes higher, but the game is managed and played a bit differently. In October, runs tend to be at a premium and as Billy Beane said, "my shit doesn’t work in the playoffs."
To look into this further, an All or Nothing factor (AoN) was calculated by taking the team’s total number of strikeouts and home runs and dividing them by plate appearances.
(SOs + HRs)/ PAs = AoN
From example, here’s a list of the AoN factor for the 2021 League Championship squads:
|
Year
|
Team
|
PAs
|
HRs
|
SOs
|
AoN
|
|
2021
|
ATL
|
6056
|
239
|
1453
|
0.2794
|
|
2021
|
HOU
|
6291
|
221
|
1222
|
0.2294
|
|
2021
|
BOS
|
6122
|
219
|
1386
|
0.2622
|
|
2021
|
LAD
|
6239
|
237
|
1408
|
0.2637
|
For comparison purposes, here are the numbers for the 1988-90 Bash Brothers A’s:
|
Year
|
Tm
|
PA
|
HR
|
SO
|
AoN
|
|
1988
|
OAK
|
6356
|
156
|
926
|
0.1702
|
|
1989
|
OAK
|
6110
|
127
|
855
|
0.1607
|
|
1990
|
OAK
|
6240
|
164
|
992
|
0.1853
|
The AoN factor was calculated for the forty LCS teams from the past ten years (2012-2021), and those numbers were graphed with the average number of runs scored per regular season game.

As one might expect there is a positive correlation between AoN and runs scored in the regular season. The same exercise was done by taking that team’s regular season AoN and graphing with the average amount of runs scored per playoff game (trendline in red).

In this graph, the specific data points were removed to make it easier to see the trend lines. The playoff data is obviously a smaller sample size but the difference in trend lines is interesting. As expected, the average number of runs scored in the playoffs is lower. Also compared to the regular season, as a team’s AoN increases, the bigger the divergence in the average number of runs scored in the playoffs. The more "disciplined" teams are closer to their season average than the All or Nothing teams. If we look at a subset of the last seven years, the difference is more drastic.

In the last seven years, almost every team has an AoN factor greater than 0.2 (the lone team is the 2015 World Champion Kansas City Royals at 0.18). For this 7-year subset, the number of runs scored in the regular season has flattened and the runs scored are at a higher level (~5 runs per game).
While it’s difficult to draw firm conclusions from this data given the sample size, it begs the question how did the different AoN tiers fare in the playoffs? The bar graph below shows how far teams in low-, mid-, and high-AoN tiers progressed into the postseason:
-
Low AoN- range 0.1783-0.2274 (13 teams)
-
Mid AoN- range 0.2281-0.2540 (13 teams)
-
High AoN- range 0.2543-0.3043 (14 teams)

Over the last ten years, the High AoN group has the least number of teams that advanced past the LCS and the least number of World Champions (2). One of the World Champion teams is this year’s Atlanta Braves with a 0.28 (third highest AoN from the 40 teams evaluated). The other is the 2020 Los Angeles Dodgers with a 0.2543 AoN (the lowest value in the High AoN group).
The same tally is done comparing the teams within each year. For example, in 2012 and 2013:
|
Year
|
Tm
|
AoN
|
Group
|
Result
|
|
2012
|
SFG
|
0.1935
|
Lowest
|
World Champions
|
|
2012
|
DET
|
0.2069
|
Mid-Low
|
Pennant
|
|
2012
|
STL
|
0.2136
|
Mid-High
|
LCS
|
|
2012
|
NYY
|
0.2281
|
Highest
|
LCS
|
|
2013
|
DET
|
0.1955
|
Lowest
|
LCS
|
|
2013
|
STL
|
0.1991
|
Mid-Low
|
Pennant
|
|
2013
|
LAD
|
0.2090
|
Mid-High
|
LCS
|
|
2013
|
BOS
|
0.2328
|
Highest
|
World Champions
|
Within each year, the League Championship team with the lowest AoN was placed in the Lowest group, the second lowest AoN was placed in Mid-Low group and so on for Mid-High and Highest groups. The bar graph (listed below) is a tally of the playoff finish of the same forty LCS teams grouped by this yearly method:
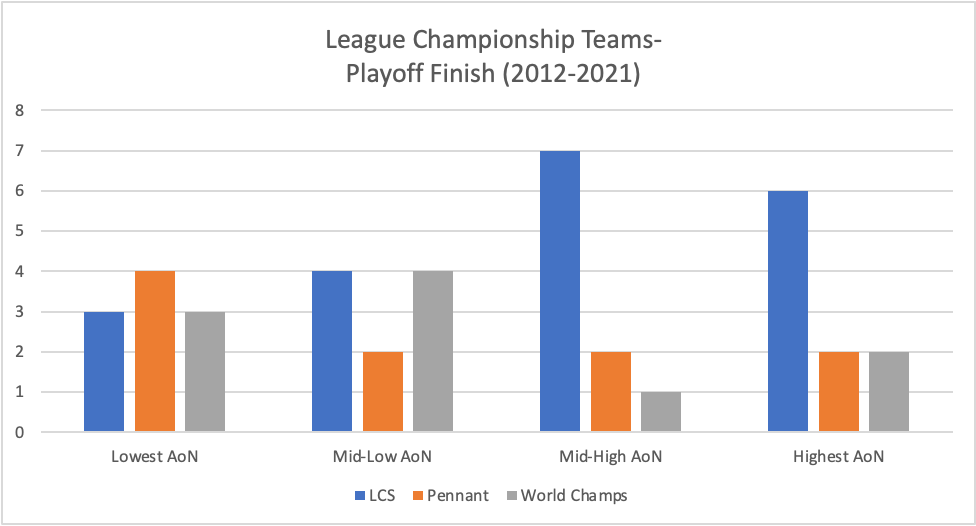
Like the previous tally, the Lowest AoN group has the greater number of teams that advanced onto the World Series. The higher AoN groups (Mid-High and Highest) have the least number of teams that advanced past the LCS, and the lesser number of World Champions (compared to the lower AoN groups- 3 vs 7).
For your reference, here’s a list of the AoN and R/G numbers for the forty LCS teams evaluated (2012-2021). And yes, this is a shameless but certainly fruitless attempt to get more action into the game. Thanks for reading.
|
Year
|
Tm
|
AoN
|
R/G
|
R/G (P)
|
Result
|
|
2014
|
KCR
|
0.1783
|
4.02
|
4.60
|
AL Pennant
|
|
2015
|
KCR
|
0.1818
|
4.47
|
5.63
|
World Champions
|
|
2012
|
SFG
|
0.1935
|
4.43
|
4.31
|
World Champions
|
|
2013
|
DET
|
0.1955
|
4.91
|
3.18
|
ALCS
|
|
2013
|
STL
|
0.1991
|
4.83
|
3.29
|
NL Pennant
|
|
2014
|
STL
|
0.2034
|
3.82
|
3.78
|
NLCS
|
|
2012
|
DET
|
0.2069
|
4.48
|
3.23
|
AL Pennant
|
|
2013
|
LAD
|
0.2090
|
4.01
|
3.90
|
NLCS
|
|
2017
|
HOU
|
0.2113
|
5.53
|
4.33
|
World Champions
|
|
2012
|
STL
|
0.2136
|
4.72
|
4.38
|
NLCS
|
|
2015
|
TOR
|
0.2219
|
5.50
|
4.73
|
ALCS
|
|
2014
|
SFG
|
0.2262
|
4.10
|
4.18
|
World Champions
|
|
2019
|
HOU
|
0.2274
|
5.68
|
3.94
|
AL Pennant
|
|
2012
|
NYY
|
0.2281
|
4.96
|
2.44
|
ALCS
|
|
2018
|
HOU
|
0.2281
|
4.92
|
5.25
|
ALCS
|
|
2020
|
HOU
|
0.2284
|
4.65
|
4.77
|
ALCS
|
|
2021
|
HOU
|
0.2294
|
5.33
|
5.44
|
AL Pennant
|
|
2018
|
BOS
|
0.2318
|
5.41
|
6.00
|
World Champions
|
|
2016
|
CLE
|
0.2325
|
4.83
|
3.60
|
AL Pennant
|
|
2013
|
BOS
|
0.2328
|
5.27
|
4.50
|
World Champions
|
|
2015
|
NYM
|
0.2387
|
4.22
|
4.43
|
NL Pennant
|
|
2016
|
CHC
|
0.2428
|
4.99
|
4.41
|
World Champions
|
|
2014
|
BAL
|
0.2440
|
4.35
|
4.71
|
ALCS
|
|
2016
|
LAD
|
0.2450
|
4.48
|
3.27
|
NLCS
|
|
2019
|
WSN
|
0.2456
|
5.39
|
4.59
|
World Champions
|
|
2016
|
TOR
|
0.2540
|
4.69
|
3.89
|
ALCS
|
|
2020
|
LAD
|
0.2543
|
5.82
|
5.61
|
World Champions
|
|
2017
|
NYY
|
0.2561
|
5.30
|
3.92
|
ALCS
|
|
2017
|
CHC
|
0.2585
|
5.07
|
2.50
|
NLCS
|
|
2017
|
LAD
|
0.2586
|
4.75
|
5.47
|
NL Pennant
|
|
2021
|
BOS
|
0.2622
|
5.12
|
5.45
|
ALCS
|
|
2018
|
LAD
|
0.2628
|
4.93
|
3.69
|
NL Pennant
|
|
2021
|
LAD
|
0.2637
|
5.12
|
4.00
|
NLCS
|
|
2019
|
STL
|
0.2643
|
4.72
|
3.56
|
NLCS
|
|
2018
|
MIL
|
0.2699
|
4.63
|
3.70
|
NLCS
|
|
2015
|
CHC
|
0.2724
|
4.25
|
3.56
|
NLCS
|
|
2019
|
NYY
|
0.2791
|
5.82
|
4.89
|
ALCS
|
|
2021
|
ATL
|
0.2794
|
4.91
|
4.06
|
World Champions
|
|
2020
|
ATL
|
0.2884
|
5.80
|
4.75
|
NLCS
|
|
2020
|
TBR
|
0.3043
|
4.82
|
3.95
|
AL Pennant
|